Course Outline — Lesson 21 of 22 ▼
L7.3 — The Trading Journal: Your Most Powerful Tool
The Trading Journal: Your Most Powerful Tool
Every claim made in this course about what improves trading — better entry criteria, tighter risk management, greater psychological discipline — requires one thing to evaluate: data. Your trading journal is where that data lives.
Without a journal, your trading history exists only in memory. Memory is selective, self-serving, and decays rapidly. Traders without journals systematically overestimate their winners, underestimate their losers, and remember their best trades more vividly than their worst. Over time, this produces a distorted view of performance that prevents honest diagnosis and meaningful improvement.
A journal turns trading from an activity into a practice — something that can be examined, measured, and improved in a disciplined, repeatable way.
What to Record
A journal does not need to be complex. The minimum viable entry records six things for every trade:
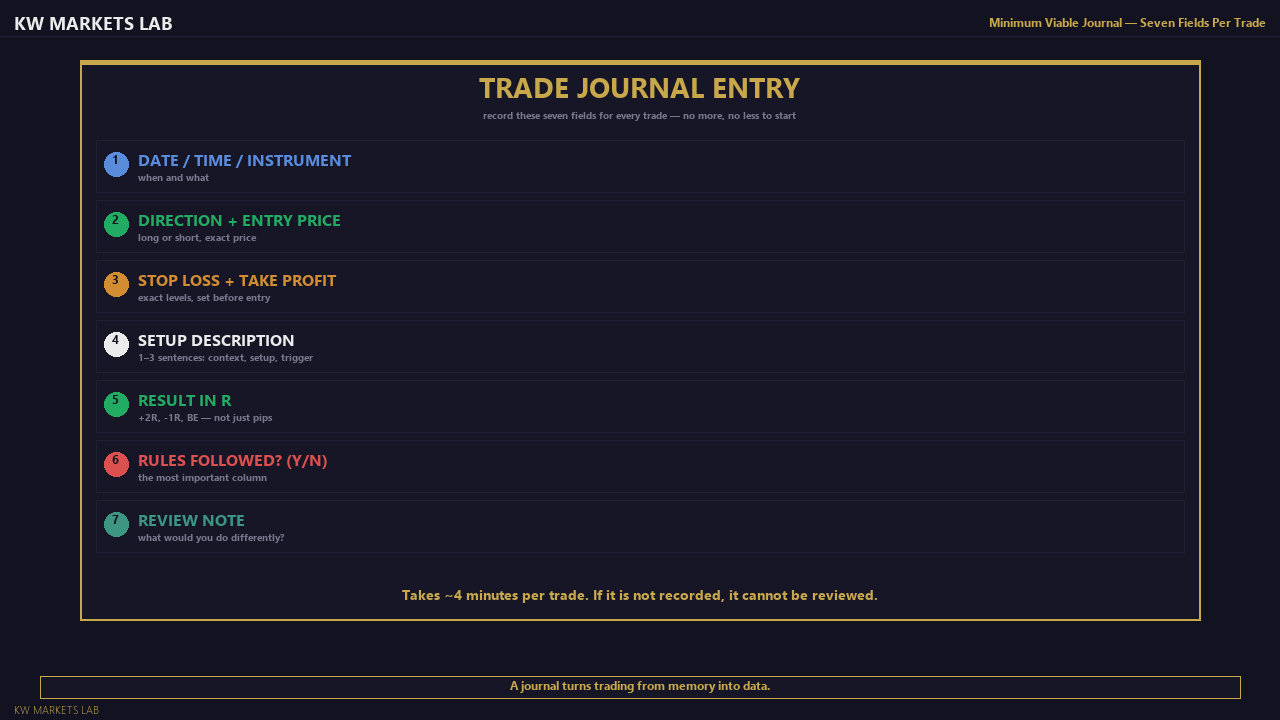
1. Date, time, and instrument
When was the trade taken and on which instrument. This allows session-based analysis (do you perform better during London or New York?) and instrument-based analysis (is your XAUUSD performance better or worse than your EURUSD performance?).
2. Direction and entry price
Long or short, and the exact entry price. Not an approximation.
3. Stop loss level and take profit level
The exact levels, recorded before entry. This confirms that these were pre-defined, not revised after the fact.
4. The setup — brief description
One to three sentences describing the context, the setup condition, and the trigger that confirmed the entry. Written as if explaining it to someone who cannot see your chart. Example: "Daily uptrend confirmed HH/HL. H4 has pulled back to the previous H4 HL area at 1.0810. M15 BOS above the M15 swing high at 1.0827. Entry long at 1.0831, stop at 1.0796 below the H4 swing low."
5. The result
The outcome in R (risk units) — not just pips or dollars. Did the trade hit the target (+2R), hit the stop (−1R), or close at breakeven (0R)? Recording in R-units allows comparison across trades of different sizes and instruments.
Also record: did you follow your rules? (Yes/No)
6. A brief review note
One to two sentences, written immediately after the trade closes. What would you do differently? Was there anything about the setup or your execution that stands out? If the trade was a rule break, what was the trigger for the break?
The Most Important Column: Rule Adherence
Of all the fields in a journal, "did I follow my rules?" is the most operationally important.
A trade that followed the rules and lost is a good trade from a process perspective. The strategy works in probabilities. A single losing trade that followed the criteria tells you nothing meaningful about whether the strategy has an edge — you need a statistically significant sample for that.
A trade that broke the rules and won is a bad trade from a process perspective. It reinforces the rule-breaking behaviour by rewarding it, which makes the next rule break more likely. It does not tell you that the strategy improved — it tells you that variance went in your favour despite a process failure.
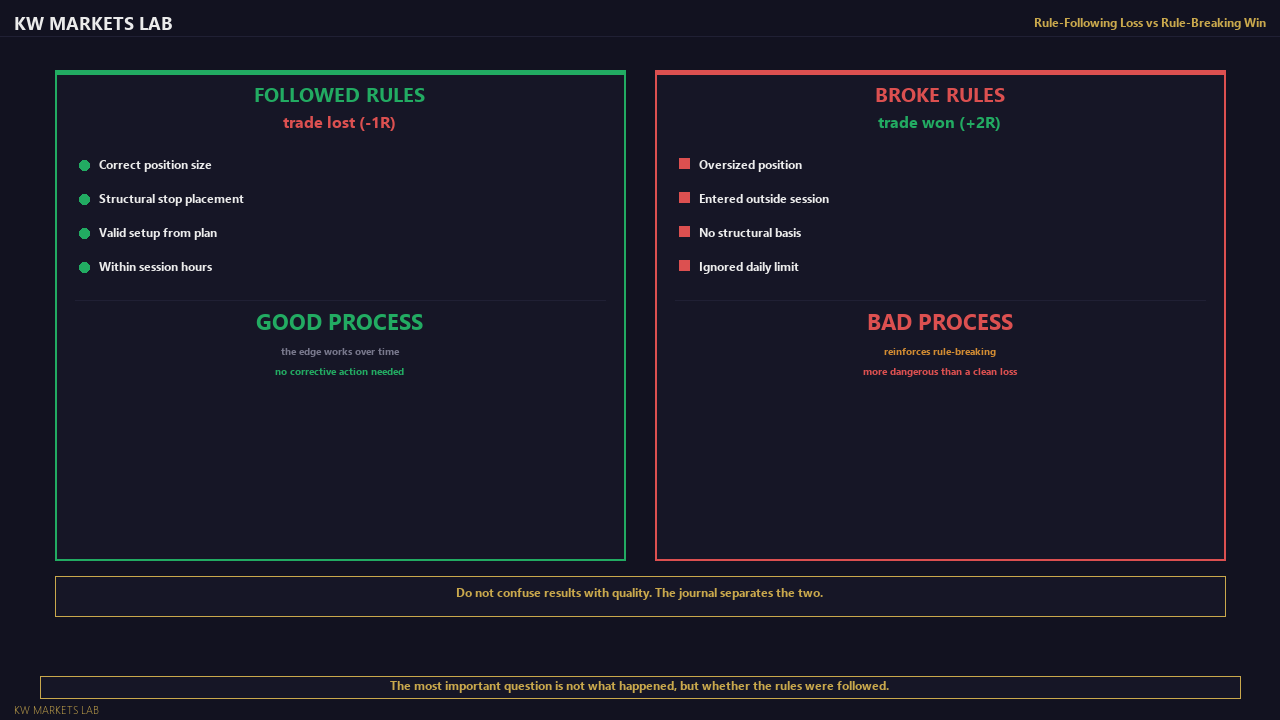
This distinction — between outcomes and process quality — is what separates traders who improve from those who do not. If every loss feels like proof the strategy is broken and every win feels like proof it is working, the journal becomes a feelings diary. If losses and wins are both evaluated against rule adherence, the journal becomes a diagnostic tool.
The Difference Between Outcome-Based and Process-Based Review
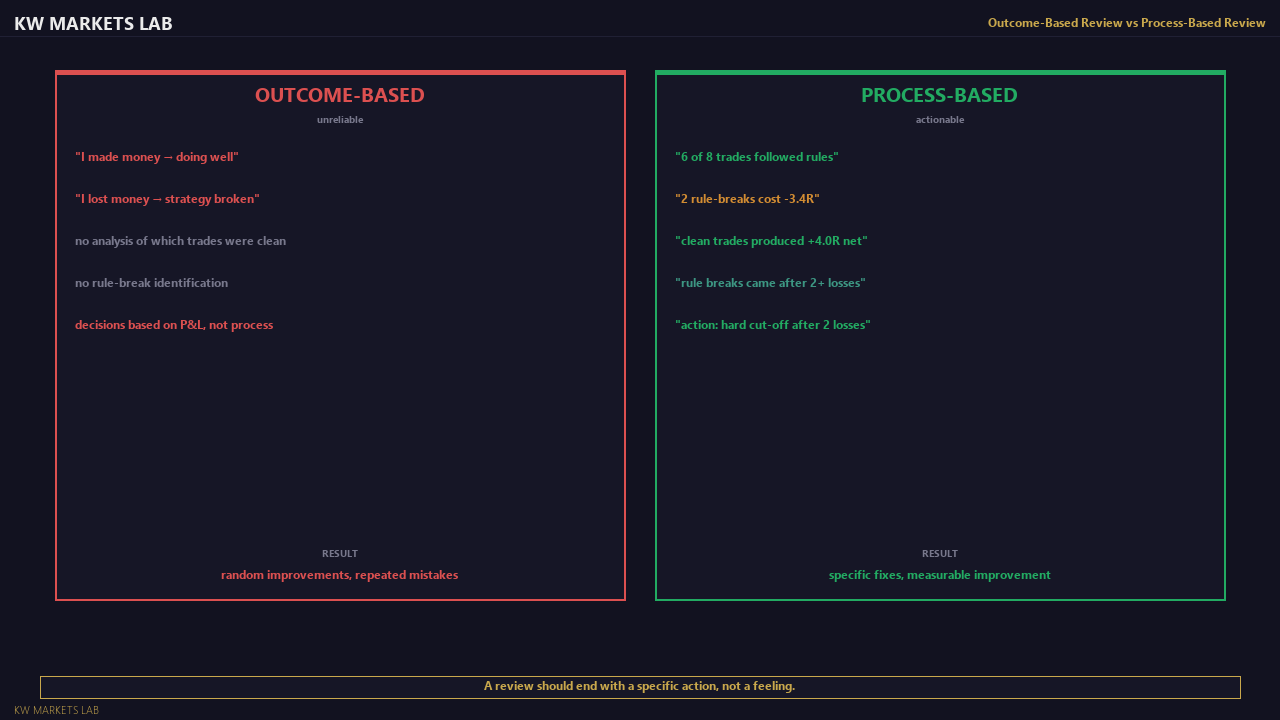
Outcome-based review: "I made money this week, so I'm doing things right." / "I lost money this week, so my strategy is broken."
Outcome-based review is natural and instinctive. It is also unreliable, because short-term results in trading are heavily influenced by random variance. A 45% win rate strategy will produce losing weeks regularly, even when executed perfectly. A 45% win rate strategy with poor execution (cutting winners early, holding losers too long) can produce winning weeks by random chance.
Process-based review: "Of the eight trades I took this week, six followed my rules completely and two involved rule breaks. The two rule breaks were both losses. The six rule-following trades produced +1.8R net. The two rule breaks produced −1.4R net. The process is working; the execution is where I have a problem."
Process-based review requires more effort and more honesty. But it produces actionable information. You know what to fix. You know the difference between "strategy not working" and "execution not working." These require completely different responses.
What a Journal Entry Looks Like
Abstract record-keeping requirements are only useful once you see a real example. Below is a single journal entry written immediately after a trade closed.
Date: 2026-03-18
Time: 09:14 London
Instrument: EURUSD
Direction: Long
Entry: 1.0831
Stop: 1.0796
Target: 1.0901
Setup description:
Daily uptrend confirmed, HH/HL intact. Price pulled back to the H4 HL zone at 1.0810–1.0825. M15 BOS above 1.0827 at 09:11. Entry at market on candle close. Stop placed 35 pips below entry, below the H4 swing low at 1.0798 with buffer.
R-result: +2.0R (target hit at 09:52)
Rules followed: Yes
Review note:
Clean execution. Waited for the BOS instead of entering early at the zone. The daily structure supported the direction strongly — no conflicting signals at any timeframe. Would take this setup again with the same criteria.
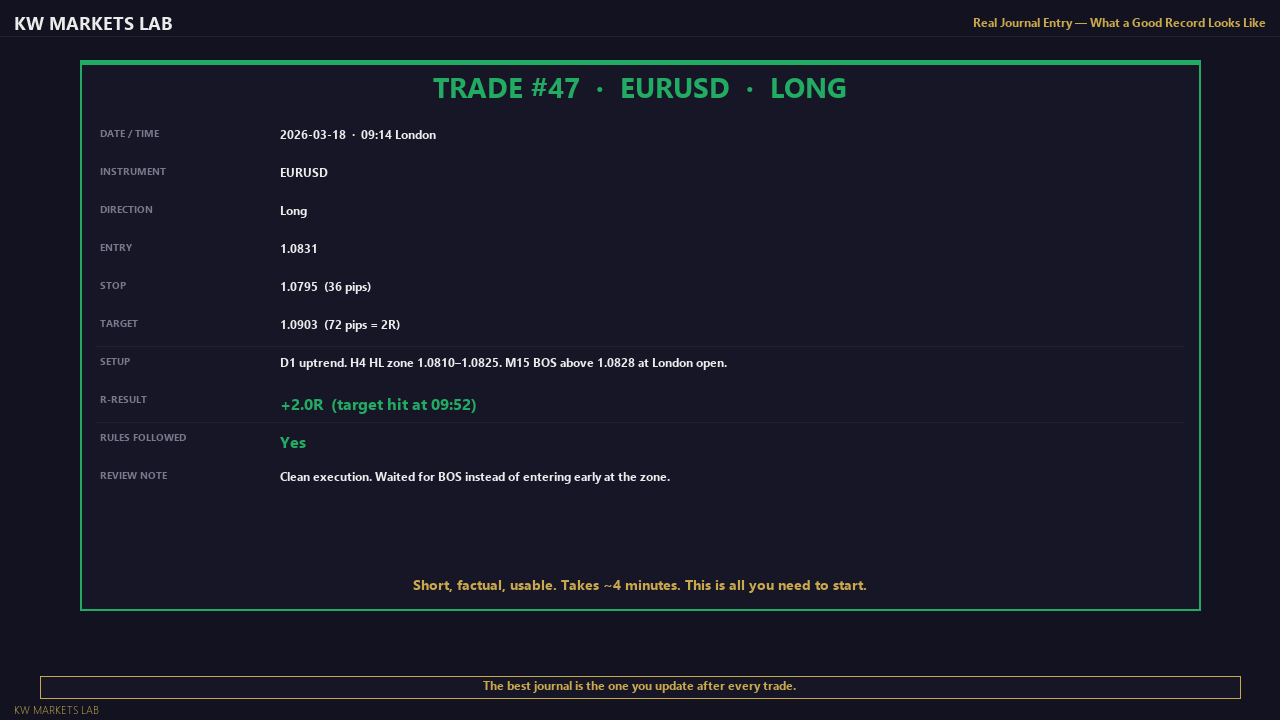
This entry takes approximately four minutes to write. It records everything needed to evaluate the trade later: the reasoning, the exact levels, the outcome in R, and whether execution matched the plan. No narrative, no excuses, no drama. Just facts.
What a Weekly Review Output Looks Like
The weekly review is not a diary entry. It is an analysis. Below is an example output from a seven-trade week.
Week of: 2026-03-17 to 2026-03-21
Total trades: 7
Rule-following trades: 6
Rule-breaking trades: 1
R-results by trade:
+2.0R, −1.0R, −1.0R, +1.8R, −1.0R, +2.2R, −2.4R (rule break)
Net from rule-following trades: +2.0 − 1.0 − 1.0 + 1.8 − 1.0 + 2.2 = +4.0R
Net from rule-breaking trade: −2.4R (stop was moved wider mid-trade — effective loss doubled)
Total net: +1.6R
Win rate (rule-following trades only): 3/6 = 50%
Average R:R on winners: ~2.0R
What the rule break was:
On Wednesday, after two consecutive losses, I widened the stop on the third trade from 30 pips to 55 pips mid-trade because I was "sure" the setup was correct and did not want to get stopped out. The trade continued against me and stopped at the wider level — turning a planned −$75 loss into a −$137.50 loss.
Session patterns this week:
My two most profitable trades were both taken before 09:30 London. The rule-break trade was taken at 13:45 after watching the charts for six hours. This is the second week this pattern has appeared.
Action for next week:
1. Hard cut-off at 10:30 London — no new positions after this time.
2. After two consecutive losses in a session, stop for the day. Do not continue regardless of how good the next setup looks.
3. Stop loss is set at time of entry and not touched. No exceptions.
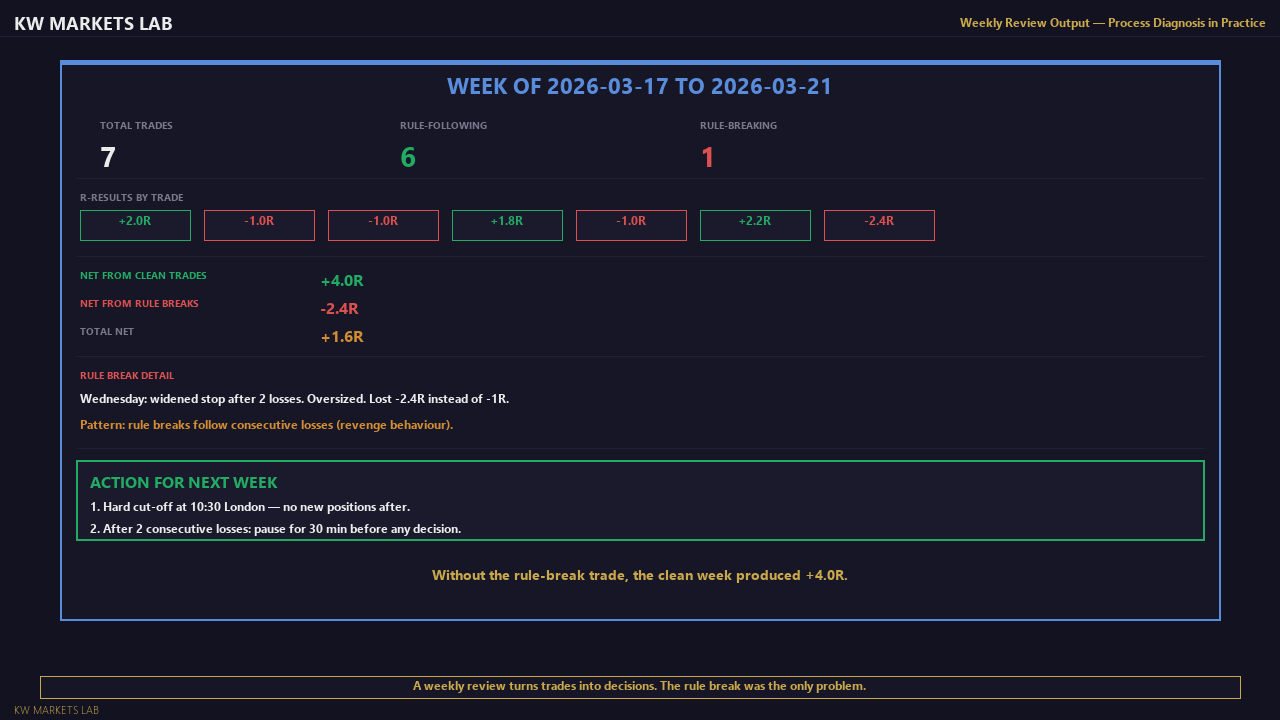
This is what process-based review looks like in practice. The week produced a small positive R result — but the review reveals that the rule-following process produced +4.0R, which the rule break eroded to +1.6R. The problem is not the strategy. The problem is execution on day three. That is the specific thing to fix.
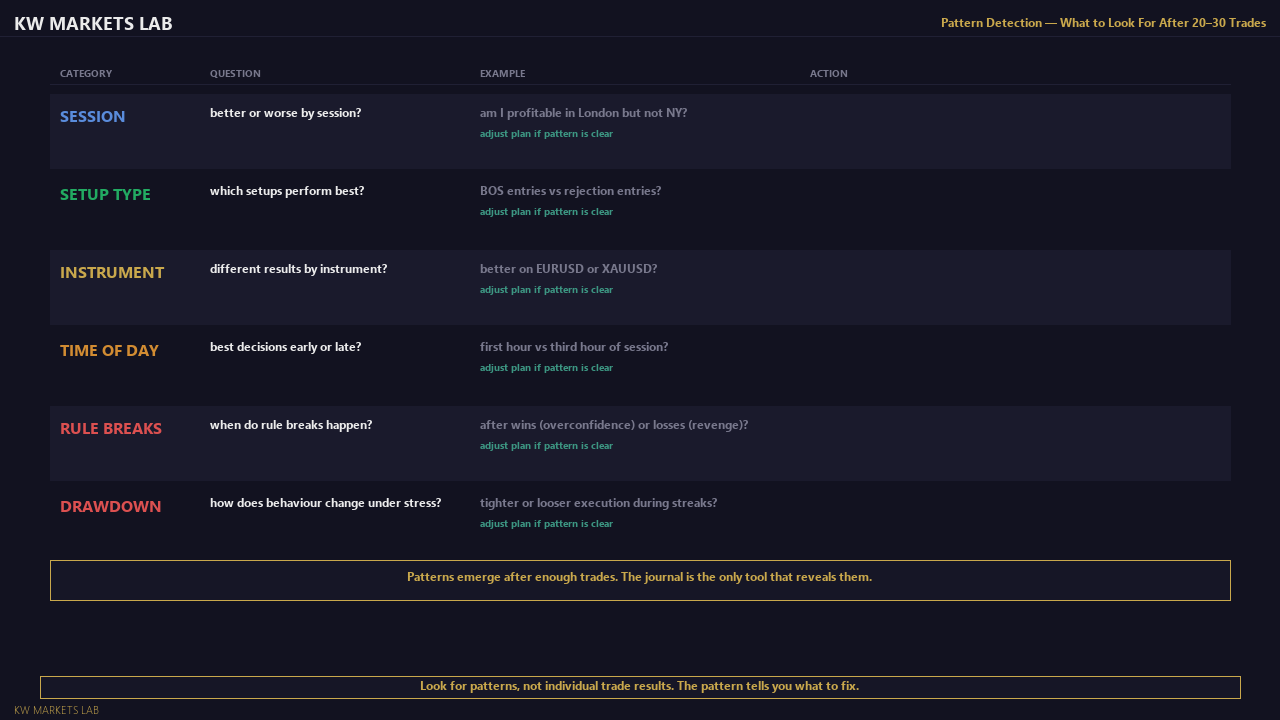
What Patterns to Look For in a Review
After twenty to thirty trades, patterns begin to emerge. The questions that reveal them:
Session patterns: Is your performance meaningfully better or worse in one session? Traders often discover they perform well during London hours and poorly during the New York session, or vice versa. This is actionable: focus on your better session.
Setup-specific patterns: If you trade more than one type of setup, which setup performs better over time? A setup with a 38% win rate and 1:3 R:R may be more profitable than a setup with a 55% win rate and 1:1 R:R, but you would not know without the data.
Instrument patterns: XAUUSD and EURUSD require different stop distances and have different volatility profiles. Some traders find they consistently time gold entries better than forex entries, or vice versa. The journal makes this visible.
Time-of-day patterns: Do you make better decisions in the first hour of your trading session, or in the third hour when you are looking for more action? Cognitive fatigue affects decision quality. Some traders discover their worst trades consistently occur in the final hour before their cut-off.
Rule-break patterns: When do you break rules? After a winning streak (overconfidence)? After a losing trade (revenge)? On Fridays (rushing to close the week)? Knowing when you are most vulnerable allows you to set additional guards at those specific times.
Drawdown patterns: What is the longest losing streak you have experienced? How does your behaviour change during a losing streak? The journal gives you factual answers instead of estimates.
Journalling Tools
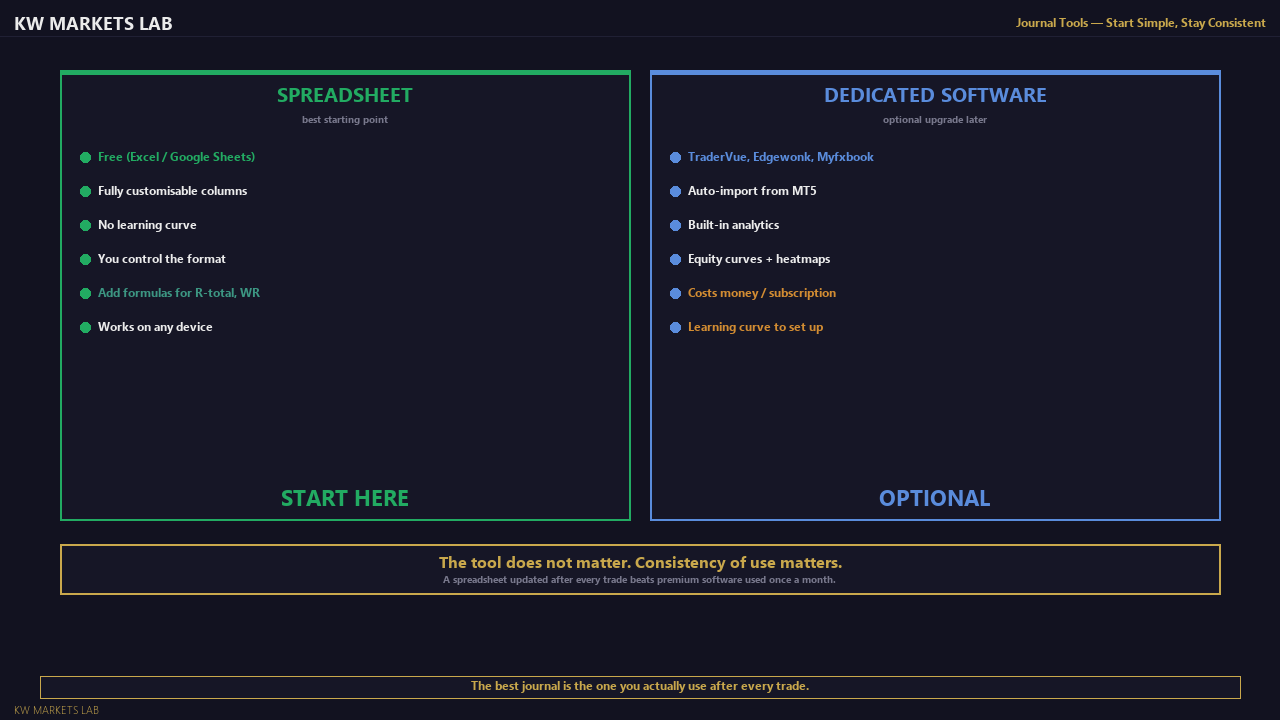
A journal does not require dedicated software. The simplest tools work well:
Spreadsheet (Excel or Google Sheets)
The most widely used format. Create columns for each field listed above. Add a calculated column for R-outcome. Add a summary section at the top that calculates: total trades, win rate, average R:R, total R, and number of rule breaks. This is the practical starting point and gives you full control over the structure.
A basic template structure:
| Date | Instrument | Direction | Entry | Stop | Target | Setup | R-Result | Rules Followed | Notes |
|---|---|---|---|---|---|---|---|---|---|
Dedicated journal software (TraderVue, Edgewonk, Myfxbook) can import trade data directly from MT5 and automate analysis — useful once you have a larger trade history. Start with a spreadsheet.
The tool does not matter. Consistency of use matters. A spreadsheet that is updated after every trade is worth more than sophisticated software that is opened once a month.
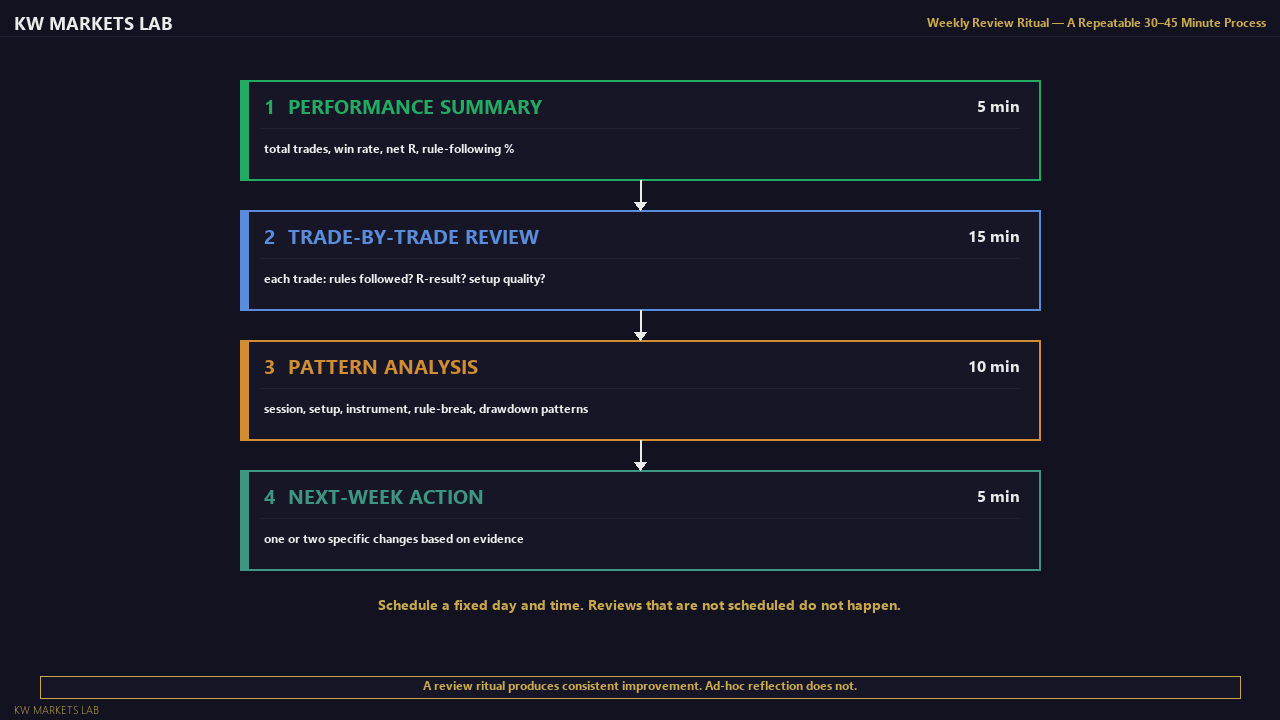
The Weekly Review Ritual
The worksheet for this module (WS-M7b) contains the full weekly review protocol — four phases, approximately 30–45 minutes. Schedule it on a fixed day each week and treat the time as non-negotiable. Saturday morning works well for most traders. The protocol only works if it becomes a ritual, not a response to bad weeks.
Why Traders Abandon Journals (and How to Not)
The most common reason traders stop journalling is that the journal reveals uncomfortable truths: losses caused by rule breaks they preferred not to acknowledge, patterns of impulsive behaviour they cannot easily fix, a win rate significantly lower than they imagined.
The discomfort is the value. A journal that only confirms your existing beliefs about your trading is not working. The findings that feel bad are exactly the findings that prevent those mistakes from recurring — but only if you keep the journal long enough to see them clearly.
Two practical approaches to maintaining the habit:
Keep the entry format short. A journal you can complete in five minutes per trade will be maintained. A journal that requires thirty minutes of detailed writing per trade will be abandoned. Start minimal — the six fields above are enough. Add detail as the habit solidifies.
Commit to a minimum duration. Commit to journalling every trade for the next 60 days, without evaluating whether it is "working" during that period. At the end of 60 days, review with 30–50 entries and decide then. A journal with 10 entries cannot show you patterns. A journal with 50 entries begins to.
Key Takeaways
- A trading journal is the only tool that turns your trading history into data you can actually use.
- The six minimum fields: date/instrument, direction/entry, stop/target, setup description, R-result + rule adherence, review note.
- Rule adherence is the most important field. Losses that followed the rules are different in kind from losses caused by rule breaks.
- Process-based review is more useful than outcome-based review. Winning weeks can hide process failures; losing weeks can mask good execution.
- After 20–30 trades, patterns become visible: session performance, setup performance, rule-break triggers.
- The weekly review ritual — scheduled, time-boxed — is the mechanism that converts journal data into behavioural change.
- Discomfort reading the journal is a signal it is working, not a reason to stop.
Module 7 Final Deliverable
By the end of this module, you should have produced three documents:
- The psychological trap self-assessment (from L7.1) — your five-session observation log identifying your dominant patterns.
- Your trading plan (from L7.2) — completed template with specific rules for instruments, sessions, entry criteria, risk rules, trade management, and review routine.
- Your trading journal (from L7.3) — set up and ready to use, with the structure you have chosen (spreadsheet, Notion, or other). First entry completed for a practice or demo trade.
These are not course assessments. They are the working tools of your trading practice. If you have built them thoughtfully, you have finished this course with more than knowledge — you have the framework to execute and the tools to improve.
Course Completion — What Comes Next
Completing this course means you have the foundational framework. You can read market structure, identify key levels, apply top-down analysis, manage risk systematically, and build a process that documents and improves your trading over time.
What the course does not give you is experience. Experience comes from screen time — from watching how price behaves at structural levels across sessions, from seeing how the Asian range resolves at the London open on gold, from experiencing the pressure of a losing trade and finding out whether your risk framework holds.
The next step is consistent, documented practice. Use a demo account if you are not yet ready to risk live capital. Apply the framework. Use the journal. Complete the weekly review. After fifty to one hundred documented trades, you will know considerably more about your specific strengths, weaknesses, and the instruments you trade than any course can tell you.
The course was the map. The journal is the territory.
Lesson Objective
By the end of this lesson, you should have a trading journal set up and ready to use, understand the difference between outcome-based and process-based review, be able to identify at least three patterns worth tracking across your trade history, and know the structure of the weekly review ritual you will maintain going forward.
Get notified when new lessons and content are published.