Course Outline — Lesson 9 of 22 ▼
L3.3 — Previous Session Highs and Lows as Reference Points
Previous Session Highs and Lows as Reference Points
The structural zones and psychological levels covered in L3.1 and L3.2 are relevant across all timeframes and persist for weeks or months. This lesson covers a different category of level — one that resets regularly and is particularly useful for intraday and swing traders: previous session highs and lows.
These levels are among the most watched reference points by professional and institutional traders. Understanding what they are, why they matter, and how to use them transforms how you read price action on the lower timeframes.
What Are Previous Session Highs and Lows?
Markets do not trade in a continuous, uniform stream. They are divided into sessions defined by geography and liquidity: the Asian session, the London (European) session, and the New York session. Each session has distinct characteristics in terms of volume, volatility, and directional tendency.
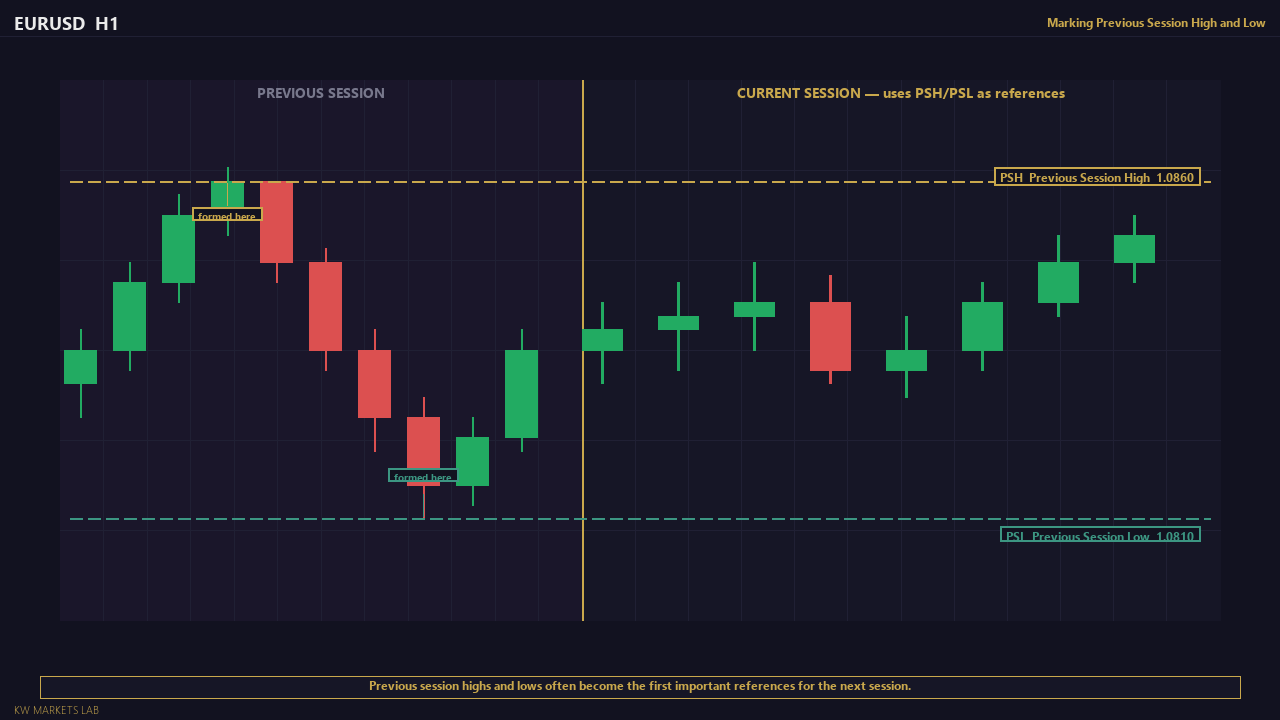
At the end of each session, the high and low of that session are recorded. These become reference points — not permanent structural levels, but dynamic context markers that most intraday traders and algorithms reference closely.
The key levels used in practice:
Previous Day High (PDH) and Previous Day Low (PDL)
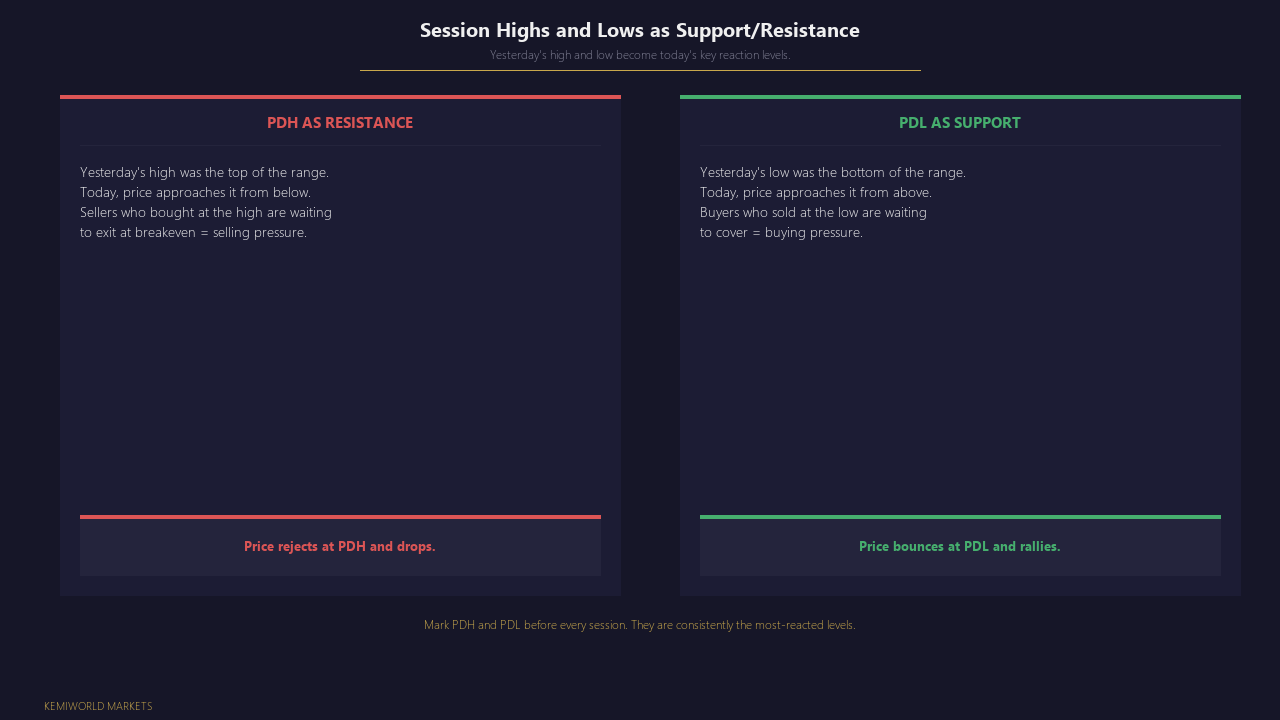
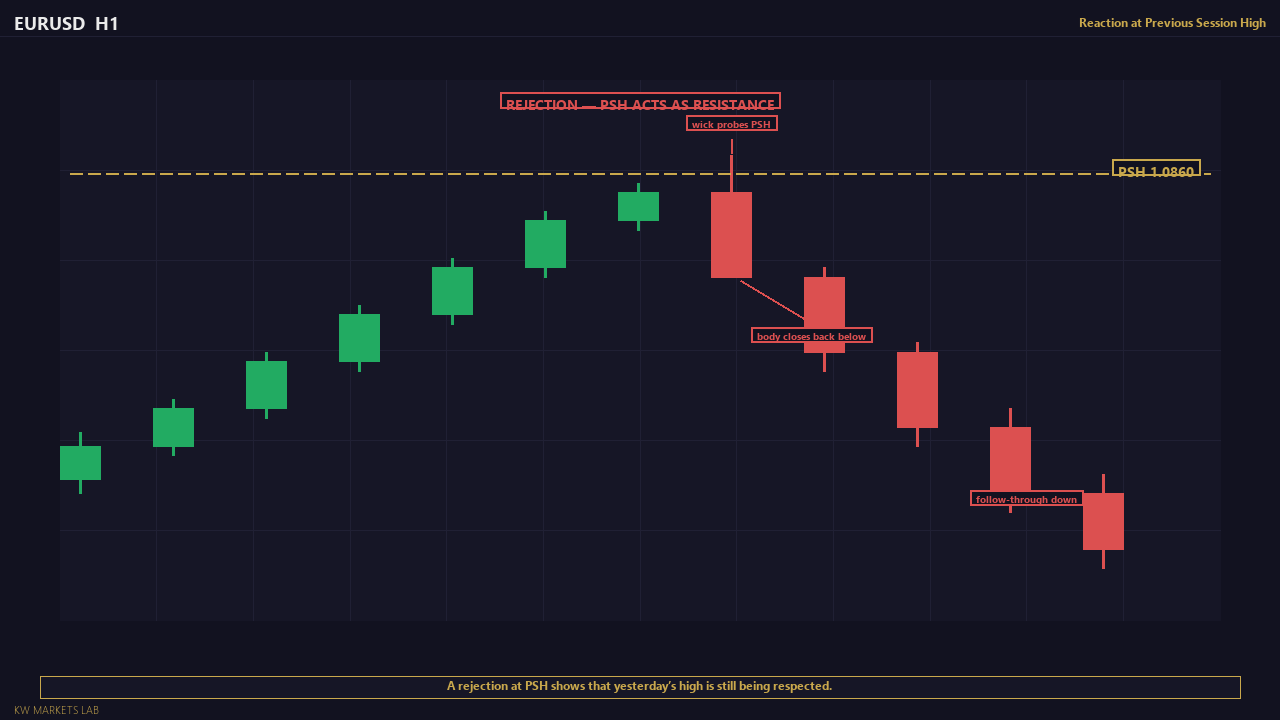
The high and low of the previous trading day. These reset daily and are among the most widely referenced intraday levels. A breakout above PDH suggests bullish continuation. A rejection at PDH suggests resistance at a significant reference point. A break below PDL signals bearish extension.
Previous Week High (PWH) and Previous Week Low (PWL)
The high and low of the previous trading week. These are more significant than daily levels and are relevant for swing traders. The range between PWH and PWL gives context for the current week's potential movement range.
Previous Session High and Low (for intraday traders)
The high and low of the most recent completed session (e.g., the Asian session high and low when you are trading the London open). This is the most granular and most time-sensitive version of the concept.
Why These Levels Matter
Order clustering. Pending orders — breakout orders, stop losses from positions taken during the prior session — cluster at previous session highs and lows. When price approaches PDH, there are likely sell orders (from traders who bought the prior day's high and have stops just above it) and buy-stop orders (from traders expecting a breakout above the prior high) sitting in that area simultaneously.
Institutional reference. Professional traders and their risk management systems reference daily and weekly highs and lows explicitly. These levels appear on institutional research, risk parameters, and algorithmic trigger conditions.
Defining the range. PDH and PDL define the "established range" — the price area already accepted in the prior session. Movement inside PDH–PDL is range continuation. Movement outside it is range extension and deserves more attention.
Bias and target anchoring. Many professional traders define daily directional bias by whether price is above or below PDH/PDL. Trading above PDH = potential for bullish extension to the next structural level. Rejection at PDH = potential for mean reversion back toward PDL.
How to Use PDH, PDL, PWH, PWL in Analysis
Step 1: Mark the levels before the session opens.
At the start of your trading day, mark the previous day's high and low on your H1 or H4 chart. Note where the current price is relative to these levels. Is price inside yesterday's range, above PDH, or below PDL?
Step 2: Identify the relevant reference for your trade timeframe.
For intraday trades (15M–H1): use PDH/PDL as primary reference, Asian session H/L as secondary.
For swing trades (H4–Daily): use PWH/PWL as primary reference, PDH/PDL as secondary.
Step 3: Use the levels in context with structure.
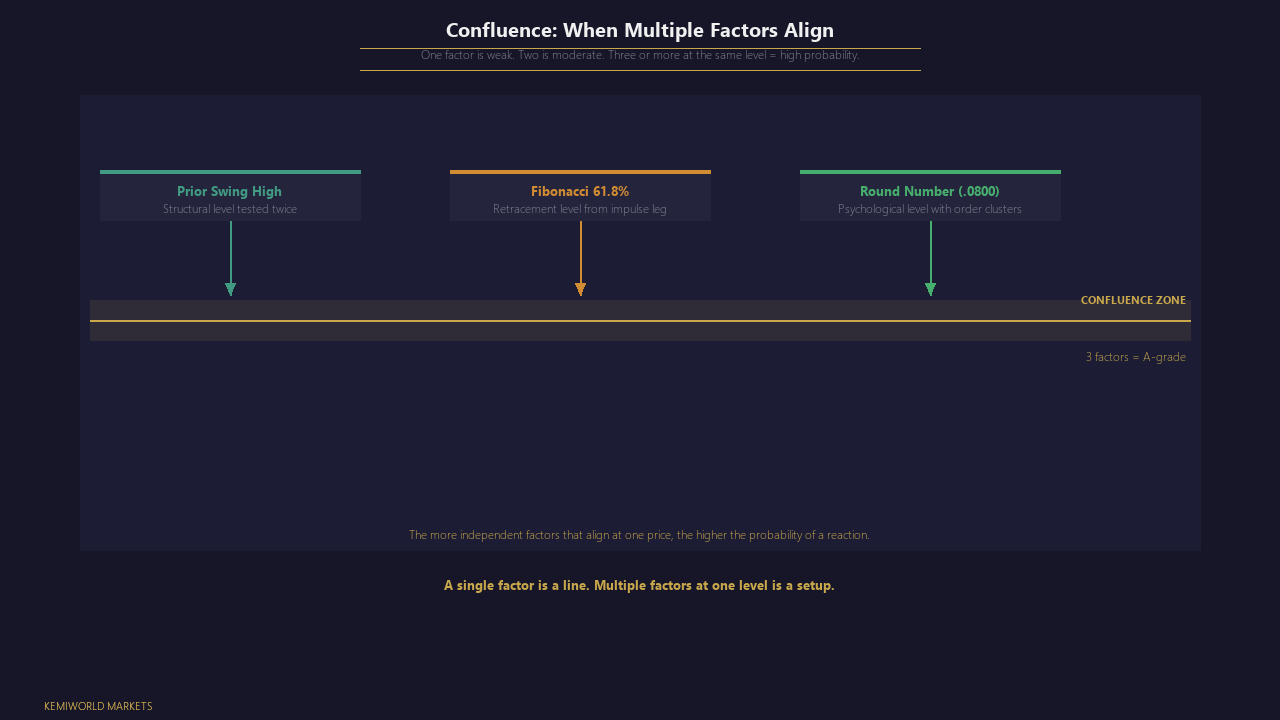
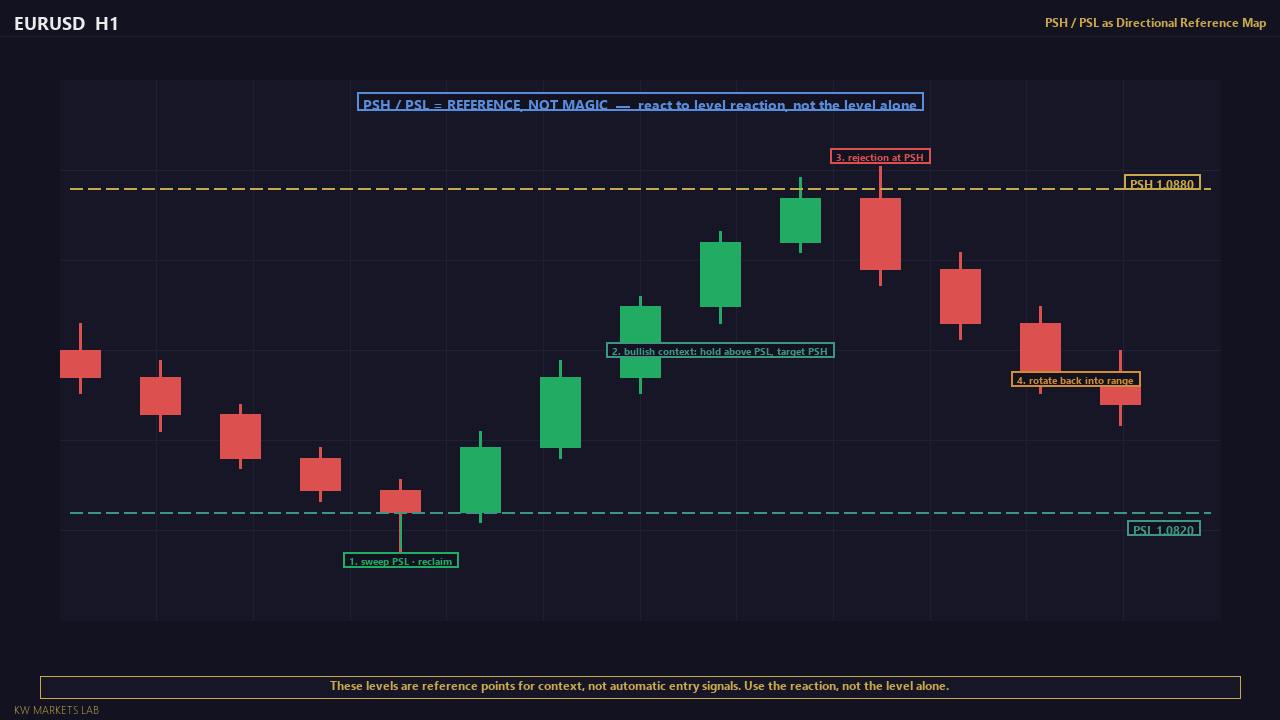
PDH and PDL are not trade signals on their own. They become significant when they align with structural zones from higher timeframes. A PDH that also sits at a weekly resistance zone is a high-conviction level. A PDH sitting in the middle of a clean weekly uptrend with no nearby structural resistance is just a reference point, not a barrier.
Step 4: Watch how price behaves at the level.
The reaction to PDH or PDL tells you about the current balance of order flow. A strong, clean break above PDH with a large bullish candle body signals that buyers are absorbing the sell orders at the level and pushing through. A series of wicks at PDH followed by rejection signals that sellers are defending the level aggressively.
The Asian Session High and Low — Specific Application
For traders focused on the London and New York opens, the Asian session high and low is one of the most useful intraday reference points.
The Asian session (approximately 00:00–09:00 London time) typically consolidates. It has lower volume and limited directional follow-through for most forex pairs and gold. The range it sets — the Asian high and Asian low — defines a "coiling zone."
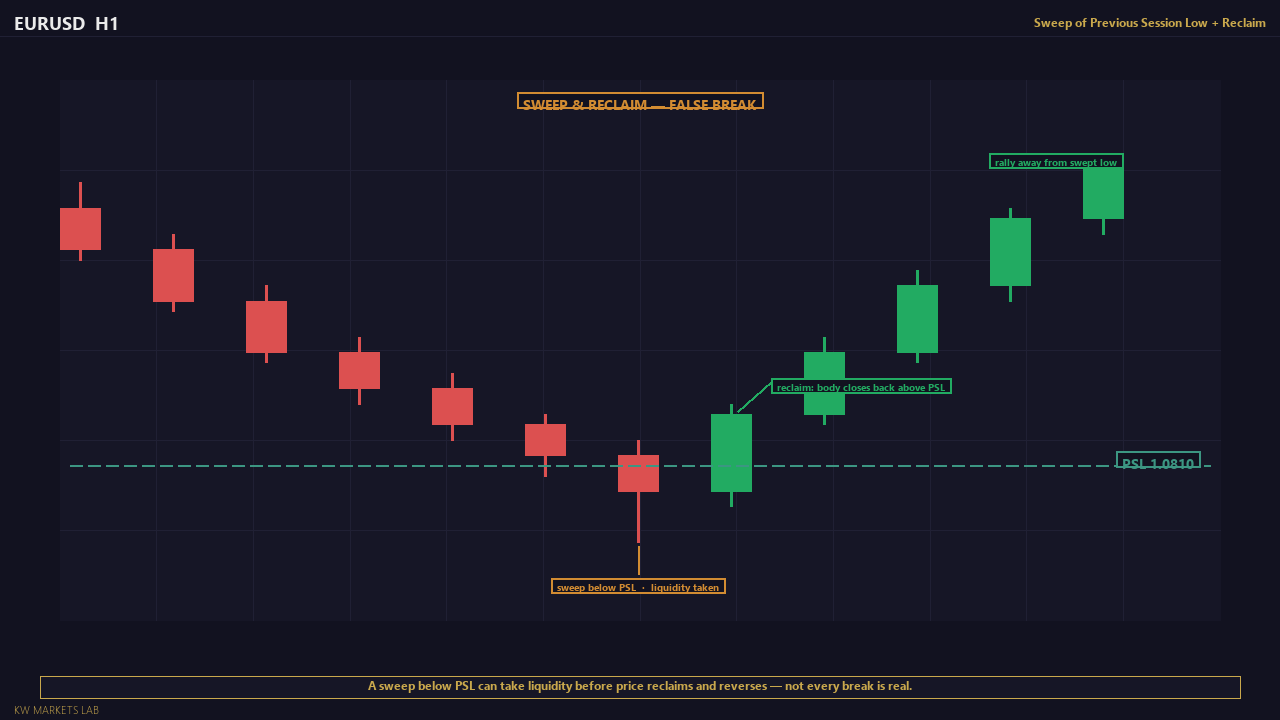
At the London open, one of the most common and studied patterns in intraday trading is:
1. Price sweeps the Asian session low (taking out retail stop losses below the coil).
2. Price reverses sharply and drives upward through the Asian session high.
3. The upward move extends into the London session with momentum.
This pattern (and its inverse for downside breakouts) is widely observed because it combines the liquidity sweep concept from L1.2 with the breakout from a defined session range. The Asian high and low serve as the boundary markers.
Common Mistakes
Treating PDH/PDL as automatic reversal zones. These levels attract attention and order clustering, but they are not guaranteed reversal points. In a strong trending market, price can break through PDH and PDL cleanly without meaningful reaction. The level matters; the context around it matters more.
Not updating the levels daily. PDH, PDL, and Asian session highs and lows are dynamic — they change every day. Traders who mark them once and forget to update are working with stale data.
Confusing PDH/PDL with structural S/R zones. These are different categories. PDH is a one-day reference that resets. A structural zone from L3.1 may have formed weeks ago and remains relevant for months. Both are useful; they serve different analytical functions.
Ignoring the level entirely when price is far away from it. The previous week high may seem irrelevant when price is 200 pips away — but it is exactly at that distance that it may be a logical target for a developing trend move. Factor it in for target setting even when it is not immediately nearby.
Key Takeaways
- PDH/PDL (Previous Day High/Low) and PWH/PWL (Previous Week High/Low) are the most-watched session reference points used by professional intraday and swing traders.
- They matter because orders cluster at these levels and because institutional risk management explicitly references them.
- The Asian session high and low is a specific, practical tool for London and NY open traders.
- These levels are most useful when they align with structural zones or psychological levels (confluence).
- They are dynamic — mark them fresh at the start of each trading day.
Module 3 Worksheet Checklist
Before moving to Module 4, confirm you can complete the following on a live chart without assistance:
- Mark the PDH and PDL on a current H1 or H4 chart and state whether current price is above, inside, or below the prior day's range.
- Mark the PWH and PWL on a Daily chart.
- Identify at least one zone where a session high or low coincides with a structural S/R zone from L3.1 (confluence).
- Identify at least one major or intermediate psychological level (from L3.2) within 1% of the current price.
- State in one sentence what your bias would be if price is above PDH in a daily uptrend.
Lesson Objective
By the end of this lesson, you should be able to mark PDH, PDL, PWH, and PWL on any chart, explain the order-flow reasoning behind why price reacts at these levels, and describe how the Asian session high and low is used as an intraday reference at the London open.
Get notified when new lessons and content are published.