Course Outline — Lesson 14 of 22 ▼
L5.2 — Reading Structure and Sessions on Gold Charts
Reading Structure and Sessions on Gold Charts
The structural analysis tools from Modules 2, 3, and 4 apply directly to gold — XAUUSD behaves as a market, and markets have structure. But gold has specific behavioural tendencies that make it trade differently from major forex pairs. Knowing these tendencies allows you to apply the framework more accurately and avoid the traps that catch traders who approach gold as if it were simply a fast-moving currency pair.
This lesson covers how the full framework applies to XAUUSD, gold's session-specific behaviour, key historical psychological levels, and the most common gold-specific traps.
Market Structure on Gold Charts
Every concept from Module 2 applies to XAUUSD:
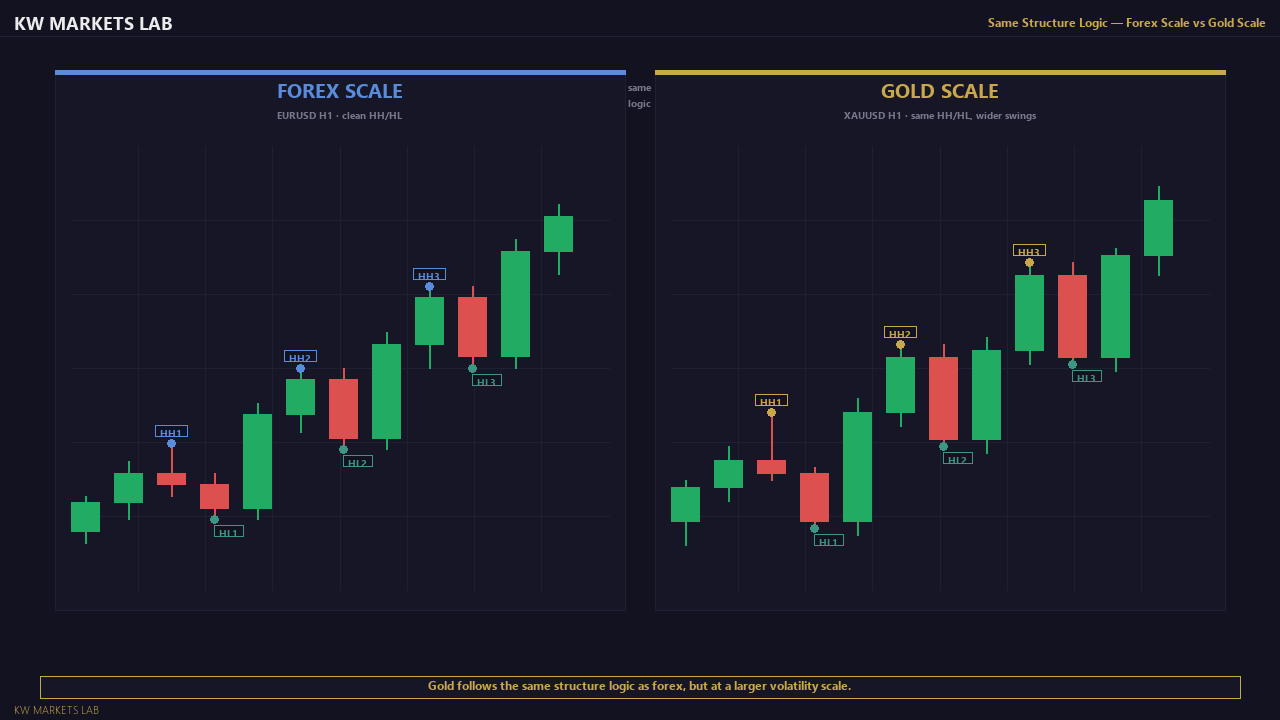
Swing highs and swing lows are identifiable on any gold timeframe, though gold's wider range means swing points are often separated by larger pip distances than forex pairs. A swing low on the daily XAUUSD chart might represent a $30–$80 range, compared to 30–80 pips on EURUSD.
Trend structure (HH/HL and LH/LL) works identically. Gold goes through extended trending phases — multi-month bull runs and sharp bearish corrections — that are clearly visible on the daily and weekly chart. The 2020–2024 bull run from $1,450 to over $2,400 is a textbook HH/HL sequence on the weekly chart.
BOS and CHOCH apply in the same way. A daily BOS above a major swing high in a gold uptrend signals continuation. A CHOCH below a major swing low signals the potential start of a corrective phase.
Support and resistance zones work reliably on gold, particularly at major levels where large institutional positioning has historically occurred. Role reversal — where prior resistance becomes support — is frequently observed at major gold level re-tests.
The key difference is scale. Gold moves faster and further than most forex pairs. A 50-pip stop on EURUSD is standard. A 50-pip ($5.00) stop on XAUUSD is dangerously tight — gold can easily move $5–$15 in a single 15-minute candle during active sessions. Stop sizing on gold must account for its volatility.
Gold's Session Behaviour
Gold has distinct behaviour in each trading session that differs from most forex pairs.
Asian Session: Consolidation and Range-Setting
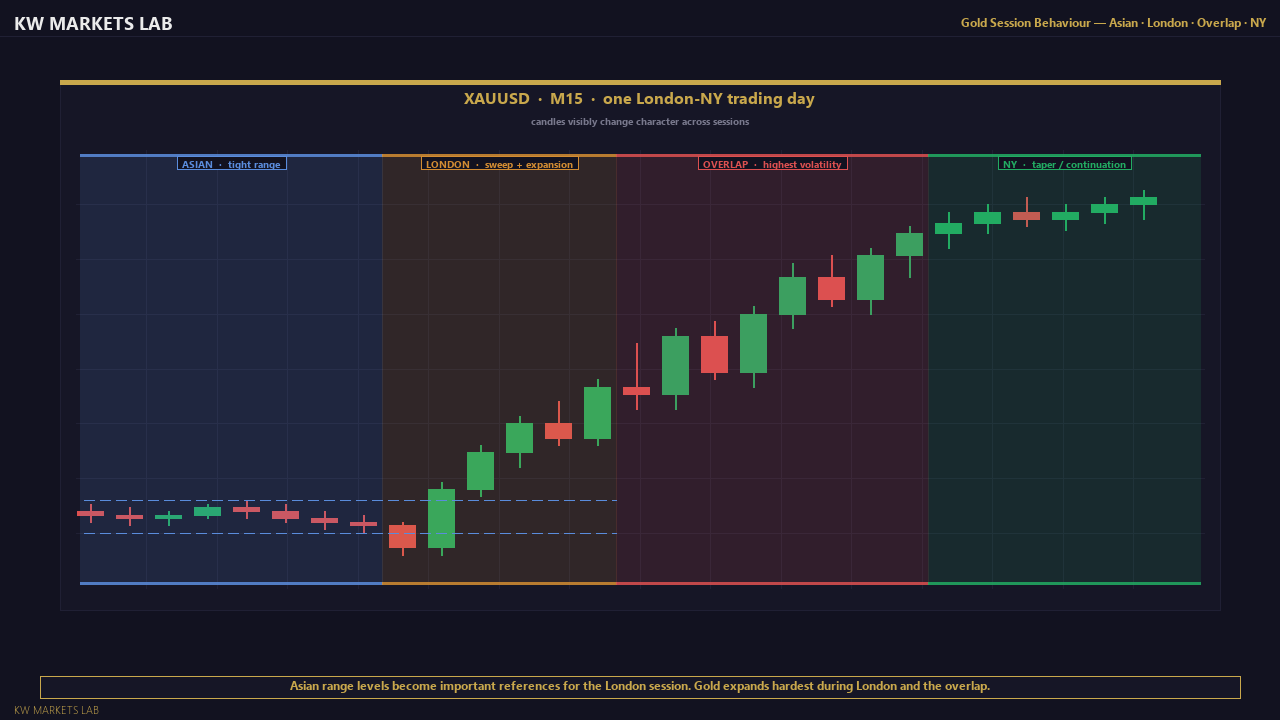
During the Asian session (00:00–09:00 London time), gold typically consolidates. Volume is lower. The institutional participants who drive directional gold moves are largely inactive. Gold is still traded — by Asian central banks, commodity traders, and Asian fund managers — but the resulting moves tend to be range-bound.
The Asian session sets a coil on the gold chart: a compressed range with defined highs and lows. These levels — the Asian session high and Asian session low — are critical reference points for the London session that follows.
Typical Asian gold range: $8–$20 on most days. On news-heavy days or following overnight geopolitical events, this range can be much wider.
London Session: The Primary Gold Session
The London open at 08:00 London time is the most important moment of the day for gold. This is when European institutional traders, gold refiners, commodity houses, and London-based hedge funds begin executing significant order flow.
Gold almost always expands from the Asian range at the London open. The direction and strength of this expansion provides the first real directional information of the trading day. Two common patterns:
- Asian low sweep then London rally: Price drops below the Asian session low (taking out retail stop losses sitting below the consolidation), then reverses sharply upward and breaks above the Asian high. This is the most common London open pattern in a broadly bullish gold environment.
- Asian high sweep then London decline: The inverse — price spikes above the Asian high, triggers breakout buy orders, then reverses sharply downward. Common when the broader gold environment is bearish or when overnight macro news has set a negative tone.
These sweeps are not always present. On days with a clean directional catalyst (overnight FOMC statement, major geopolitical event), gold may break directly from the Asian range without a sweep.
London–New York Overlap: Highest Volatility
The overlap period (13:00–17:00 London) amplifies whatever directional move London has started. US data releases within this window — particularly CPI, NFP, and FOMC — produce the largest intraday moves in gold of any session. During major data releases, gold can move $30–$80 in minutes.
For traders without experience of trading through major data releases, the safest approach is to be flat before the release and wait for the volatility to settle before looking for a post-data structural setup.
New York Session (Post-Overlap): Continuation or Reversal
After 17:00 London, volume in gold begins to taper. The moves that remain tend to be either continuation of the London direction or a mean-reversion as New York traders begin closing daily positions. The highest-quality gold setups are typically completed before 17:00 London.
Key Psychological Levels in Gold
Gold's major psychological levels are among the most widely watched in any financial market. These are levels that have played a historical role as major resistance (before break) or major support (after break).
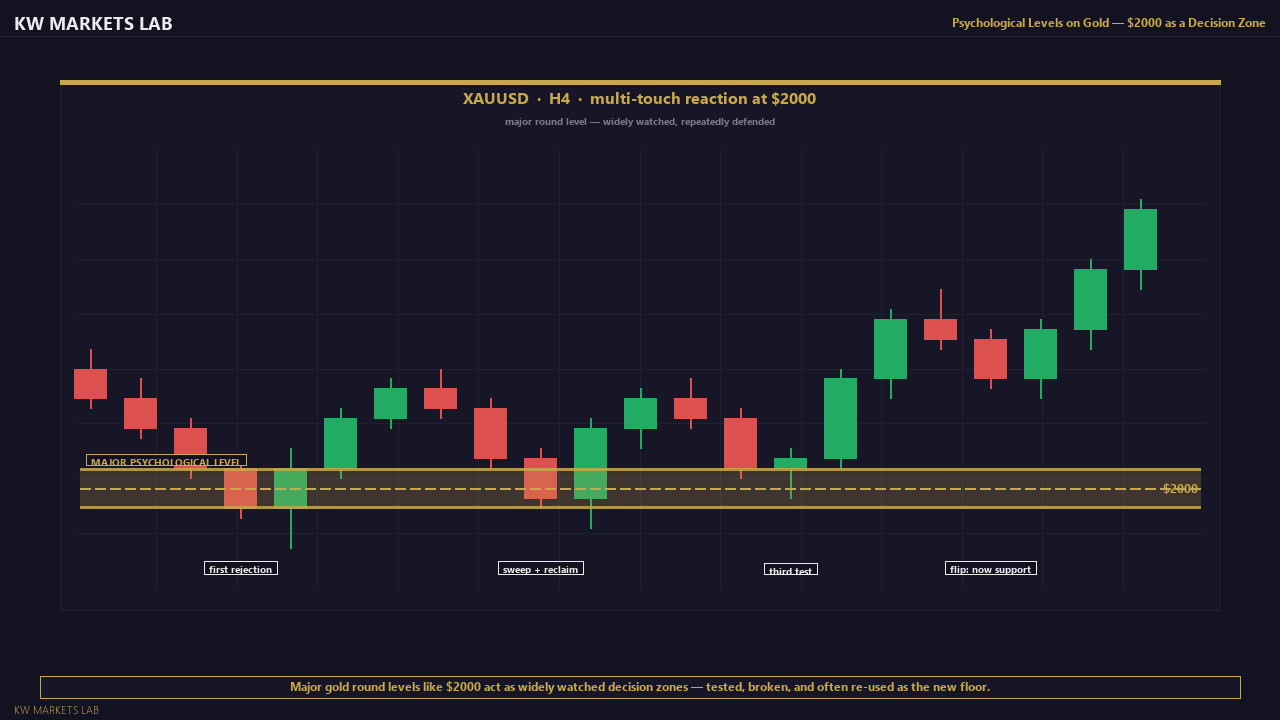
$2,000 (major)
Gold first reached $2,000 briefly in August 2020. It tested and failed to hold the level multiple times before decisively breaking above it in 2023. Once broken, $2,000 became major support and has been referenced globally as the threshold between "gold is expensive" and "gold is in a new regime."
$2,100 (major)
The first significant psychological milestone after $2,000. Gold encountered significant resistance here in late 2023 before the breakout in early 2024.
$2,500 (major)
A major target level that gold pushed through during the 2024 bull run. Now a reference point for pullback support.
$1,800 and $1,900 (historical)
Former resistance levels that became support during the 2022–2023 period. Now below current price but relevant as historical anchors.
Intraday psychological levels
On shorter timeframes, $XX50 and $XX00 levels within the current price range attract disproportionate attention. If gold is at $2,340, the $2,350 and $2,300 levels are active intraday reference points. The same order-clustering logic from L3.2 applies.
Worked Example: A London Open Gold Setup
This is what the full analysis process looks like applied to gold on a typical London session morning.
Scenario: 07:30 London time. XAUUSD is at $2,318. You are about to run your pre-session analysis.
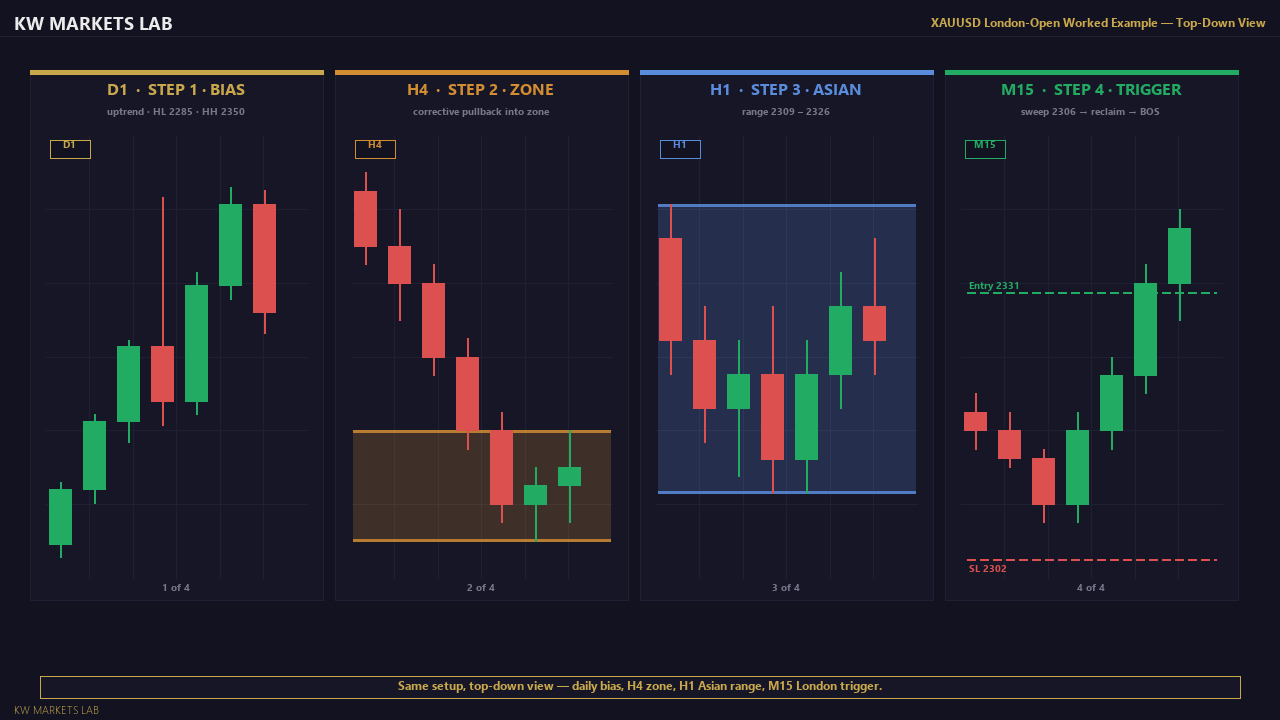
Step 1 — Daily chart
The Daily chart shows:
- A clear uptrend: the last confirmed HL is at $2,285. The most recent HH is at $2,350.
- Price has pulled back from $2,350 and is currently approaching the previous Daily swing high at $2,310–$2,320 — a potential role-reversal zone where former resistance may now act as support.
- No major data release is scheduled today. DXY is flat overnight.
Daily bias: bullish. Looking for long setups.
Step 2 — H4 chart
The H4 chart shows:
- The pullback from $2,350 has been corrective — three declining H4 candles with small bodies and long wicks. No impulsive selling structure.
- The H4 HL sits at $2,295. The entry zone is $2,295–$2,322 (between H4 HL and the Daily S/R zone).
- Price is currently at the top of the entry zone.
Step 3 — H1 chart and Asian session review
You mark the Asian session range:
- Asian high: $2,326
- Asian low: $2,309
Price consolidated in this $17 range overnight. No significant directional move. The range is intact.
H1 structure: a small series of HH/HL is forming from the $2,309 Asian low. Price is at $2,318, mid-range.
Step 4 — M15 entry trigger
You now wait for the London open pattern. Two scenarios you are prepared for:
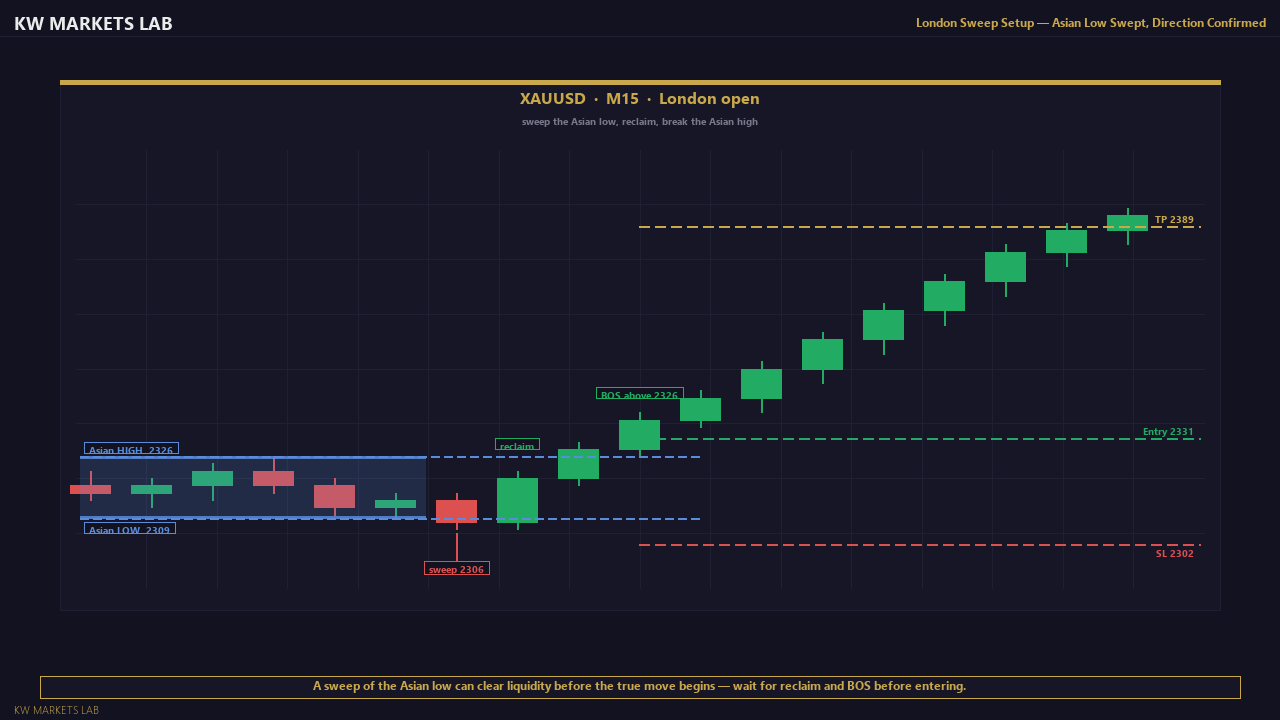
Scenario A (most common in a bullish environment):
Price drops below the Asian low at $2,309, sweeps the liquidity sitting below it (retail stops from overnight longs), then reverses sharply upward and breaks above the Asian high at $2,326. This confirms London direction as bullish. You look for a M15 BOS above $2,326 and enter long.
Scenario B (direct breakout):
Price moves directly above $2,326 without a sweep, then pulls back to $2,318–$2,322 and forms a M15 BOS. You enter on the structural confirmation.
At 08:12 London time: price dips to $2,306 (sweeping below the Asian low at $2,309), then rapidly recovers. By 08:25, price has broken above $2,326 with a strong bullish M15 candle closing at $2,331.
Scenario A confirmed. Entry:
- Entry: $2,331
- Stop: $4 below the sweep low at $2,306 → $2,302 (29-pip stop, reflecting gold's typical volatility)
- Target: H4 HH at $2,350 → 19 points
- Risk:Reward: 1:0.65 at first target. You decide to take 50% off at $2,350 and trail remaining to $2,380.
You calculate position size: if your account is $10,000 and you risk 1%, your dollar risk = $100. Stop distance = $29. Position size = $100 ÷ $29 ≈ 0.03 lots.
Why the sweep matters
The Asian low sweep at $2,306 is not random. It is the London institutions clearing out the retail stop losses placed below the overnight range before committing to the directional move. This is why trading the initial London direction before the sweep is resolved is high risk — you are on the wrong side of the institutional clearing operation.
Waiting for the sweep to complete and the Asian high to break is the structure-informed entry, not a guess at direction.
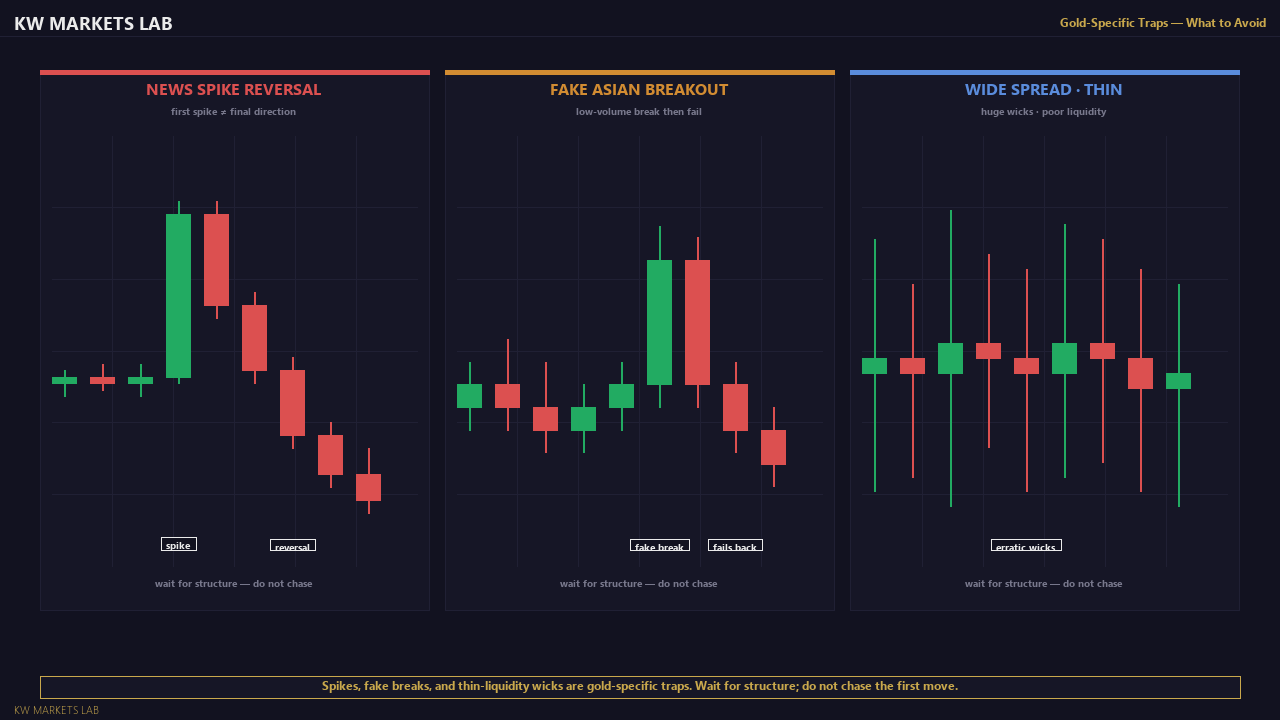
Common Gold-Specific Traps
News spike reversals
Gold's immediate reaction to major data releases is frequently not the final direction. A CPI print that initially spikes gold $30 higher is sometimes followed by a reversal as traders digest the implications for Fed policy. Trading the first candle of a news spike is extremely high risk. Wait for the spike to complete, for price to show a structural signal in the post-spike chart, and only then consider an entry.
Wide spread during low-volume periods
During the Asian session and especially in the hour before and after the weekend close/open, broker spreads on gold widen significantly — sometimes from 20–30 cents in peak hours to $1.50–$3.00 during quiet periods. A wider spread means your trade starts further offside and requires more movement to reach breakeven. Factor spread into your position sizing and stop placement.
Asian session "fake" breakouts
During the Asian consolidation, gold sometimes makes a small, low-volume break above or below the Asian range that is quickly reversed. These are often spread-driven ticks or thin-market momentum moves with no institutional commitment behind them. Do not treat an Asian-hours breakout as a confirmed directional move without volume confirmation. Wait for the London session to show its hand.
Over-sizing due to "it's only gold, it always comes back"
Gold's long-term tendency to appreciate does not help a short-term position that is 200 pips offside. Gold can sustain sharp corrections of $100–$200 over days or weeks. It does not "always come back" on the timescale of an individual trade. Apply the same position sizing discipline from M6 — do not allocate larger size to gold because you believe in it fundamentally.
Applying Top-Down Analysis to Gold
The Module 4 top-down framework applies directly:
Weekly/Daily: Identify the dominant gold trend. Is it a clear HH/HL bull run, a LH/LL corrective phase, or a range? Mark the key structural zones and major psychological levels ($2,000, $2,100, $2,500, etc.).
H4: Identify the swing structure within the daily trend. Locate the entry zone — the pullback area in an uptrend or the bounce area in a downtrend.
H1: Confirm price is approaching the entry zone. Check whether the London session has given a clear directional break from the Asian range.
M15: Look for the entry trigger — a structural confirmation in the direction of the daily bias, at the H4 entry zone.
Pre-entry: Run the fundamental check from L5.1. Is there a major data release coming? What is the DXY doing? Is risk sentiment aligned?
Module 5 Case Study Worksheet
On the current XAUUSD Daily chart:
1. Identify the current trend structure (HH/HL, LH/LL, or range).
2. Mark the two most relevant structural zones and any major psychological levels near the current price.
3. On the H4 chart, identify the current swing structure and entry zone.
4. On the M15 chart, mark the most recent Asian session high and low.
5. State what pattern you would look for at the London open to confirm a directional entry (sweep of Asian low then bullish BOS, or sweep of Asian high then bearish BOS, or direct breakout).
6. Run the fundamental check from L5.1 for today's date.
Key Takeaways
- All structural concepts from M2 and M3 apply to gold — the difference is scale: gold moves faster and further than most forex pairs.
- Asian session consolidation sets the range. London expansion resolves it, often with a liquidity sweep of the Asian high or low before direction.
- The London open (08:00 London) is the primary gold trading session. The London–NY overlap is the highest-volatility window.
- Major psychological levels ($2,000, $2,100, $2,500) are among the most widely watched in global markets.
- News spikes are traps for reactive traders. Wait for post-spike structure before entering.
- Apply the same position sizing discipline to gold as to any other instrument — its volatility requires it, not an exception to it.
Lesson Objective
By the end of this lesson, you should be able to apply the full structural and top-down analysis framework to a XAUUSD chart, identify the Asian session range and describe the London open breakout pattern, name the major psychological levels in gold, and explain the four most common gold-specific trading traps.
Get notified when new lessons and content are published.