Course Outline — Lesson 11 of 22 ▼
L4.2 — Timeframe Selection: What Each Timeframe Is For
Timeframe Selection: What Each Timeframe Is For
Most traders start by finding a single timeframe they are comfortable with and using it for everything: direction, structure, levels, and entry. This approach produces contradictory signals and missed context. Timeframes are not interchangeable. Each one serves a specific purpose in a structured analysis process.
This lesson defines the role of each timeframe clearly and explains the fatal error that beginners make when they use only one.
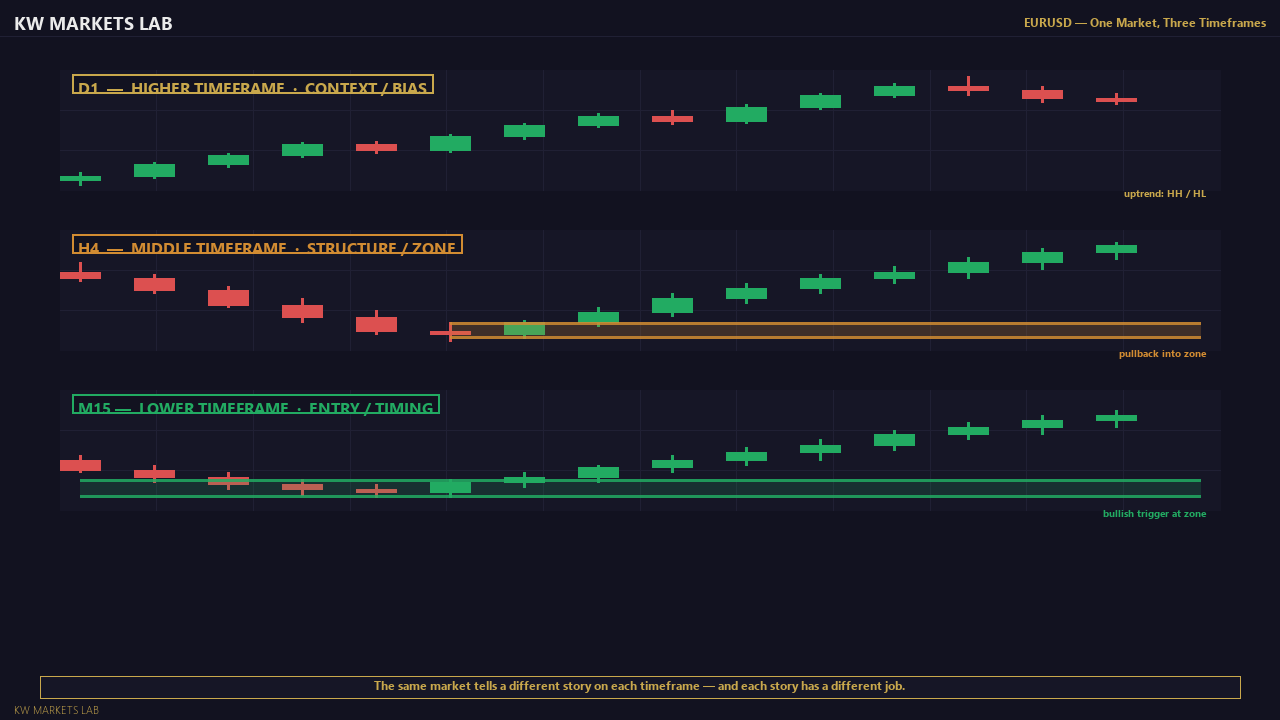
The Core Principle: Each Timeframe Serves a Different Purpose
A financial market exists simultaneously across all timeframes. The price of EURUSD right now is the same whether you are looking at a 5-minute chart or a weekly chart. What changes is how much history you can see, how large each individual candle's body is, and which structural moves are visible.
The practical implication: information from higher timeframes is more significant than information from lower timeframes. A structural zone on the weekly chart has more weight than one on the 15-minute chart. A trend on the daily chart represents a more durable directional bias than a trend on the 1-hour chart.
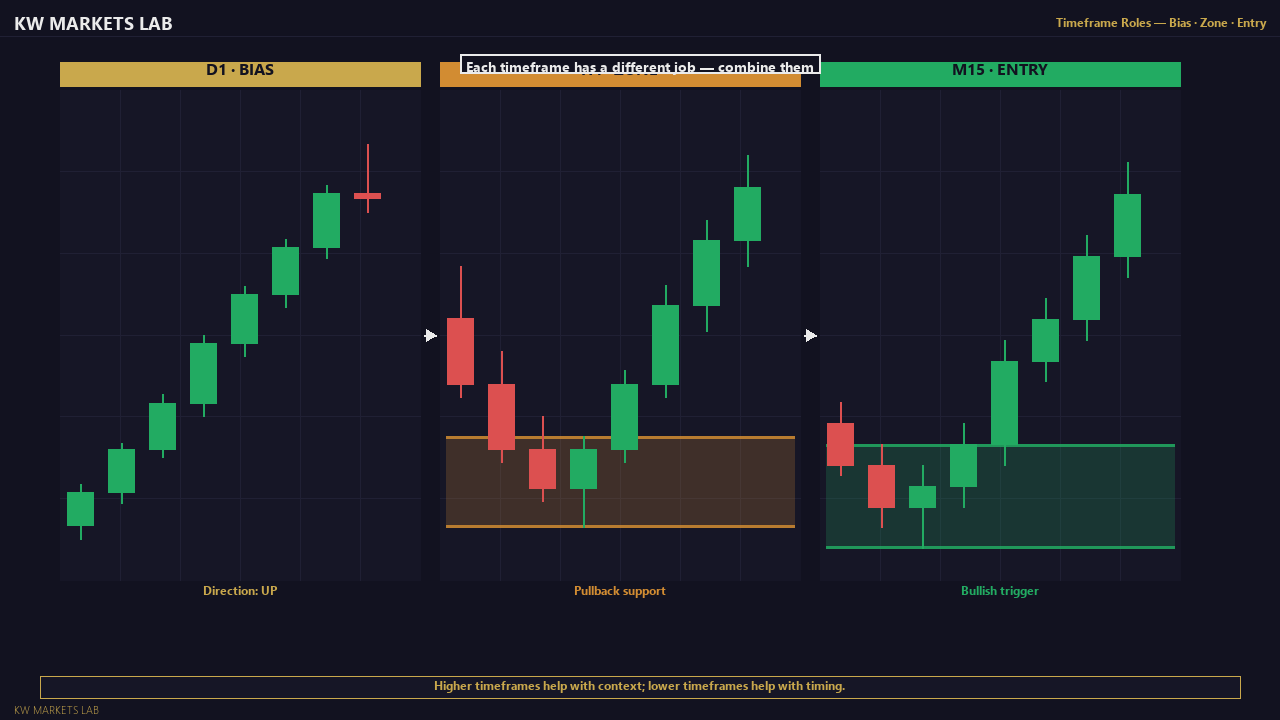
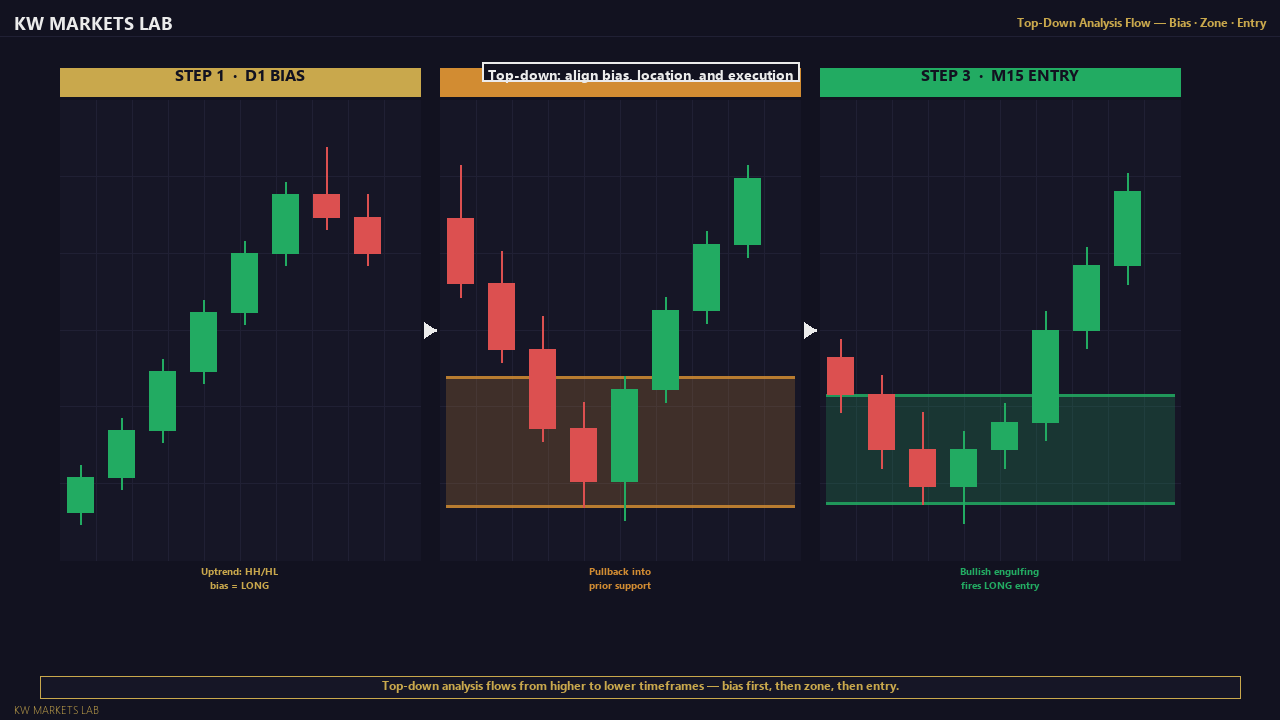
This creates a hierarchy. Higher timeframes provide the context — the answer to "what direction is the market generally moving and where are the major levels?" Lower timeframes provide the execution detail — the answer to "where specifically should I enter, and when?"
The Timeframe Framework
Weekly (W1) — Major Structural Context
Use for: identifying the dominant long-term trend, marking major structural zones, and understanding where price is in the multi-week picture.
The weekly chart shows one candle per trading week. A weekly resistance zone may have formed months ago and remain relevant for months to come. A weekly trend confirms the macro direction before you commit to any medium-term bias.
Most retail swing traders and position traders reference the weekly chart as their highest timeframe. Day traders often skip it, which is a mistake — a weekly resistance sitting just above your entry point deserves to be known about, even if you are trading intraday.
Daily (D1) — Primary Directional Bias
Use for: determining the medium-term trend, identifying major daily S/R zones, marking PDH/PDL, and establishing the primary directional bias for the trading week.
This is the most important timeframe for the majority of retail traders who swing trade or do multi-session analysis. The daily chart shows what the market consensus has been for each full trading day. Daily trends are durable and reliable. Daily structural breaks (BOS/CHOCH) signal meaningful shifts in market behaviour.
4-Hour (H4) — Swing Structure and Entry Zone Context
Use for: identifying the medium-term swing structure within the daily trend, locating the entry zone (the area where a trade setup will form), and confirming directional alignment with the daily chart.
The H4 chart is where you see the internal structure of daily moves. A daily uptrend contains multiple H4-level HH/HL sequences. A daily pullback appears as H4 bearish structure within the larger daily uptrend. The H4 chart tells you: "within the daily trend, where is price right now, and what is the nearest relevant structure?"
1-Hour (H1) — Entry Zone Refinement and Timing
Use for: refining the entry zone identified on H4, reading the intraday structure around a level, and identifying when price is approaching the entry area with momentum.
The H1 chart provides the bridge between the H4 structural picture and the entry trigger. It shows whether price is approaching a key level with strong momentum, with a weak drift, or in a choppy range — all of which affect entry quality.
15-Minute (M15) — Entry Trigger and Confirmation
Use for: identifying the specific entry trigger. A price action confirmation candle, a structural micro-break in the direction of the trade, or a liquidity sweep followed by a reversal — these are all visible and readable on M15.
The M15 chart is where you decide to enter or not. It should only be consulted once the higher timeframes have given you a reason to be looking for an entry in that direction, at that level.
5-Minute (M5) and Lower — Execution Only
Use for: precise entry point execution and managing the first few minutes of a trade. Not for directional analysis.
Trading from the 5-minute chart as your primary analysis timeframe is a common beginner trap. The noise-to-signal ratio is very high at M5. Every minor candle appears as a significant move. The structural picture is meaningless without H1+ context.
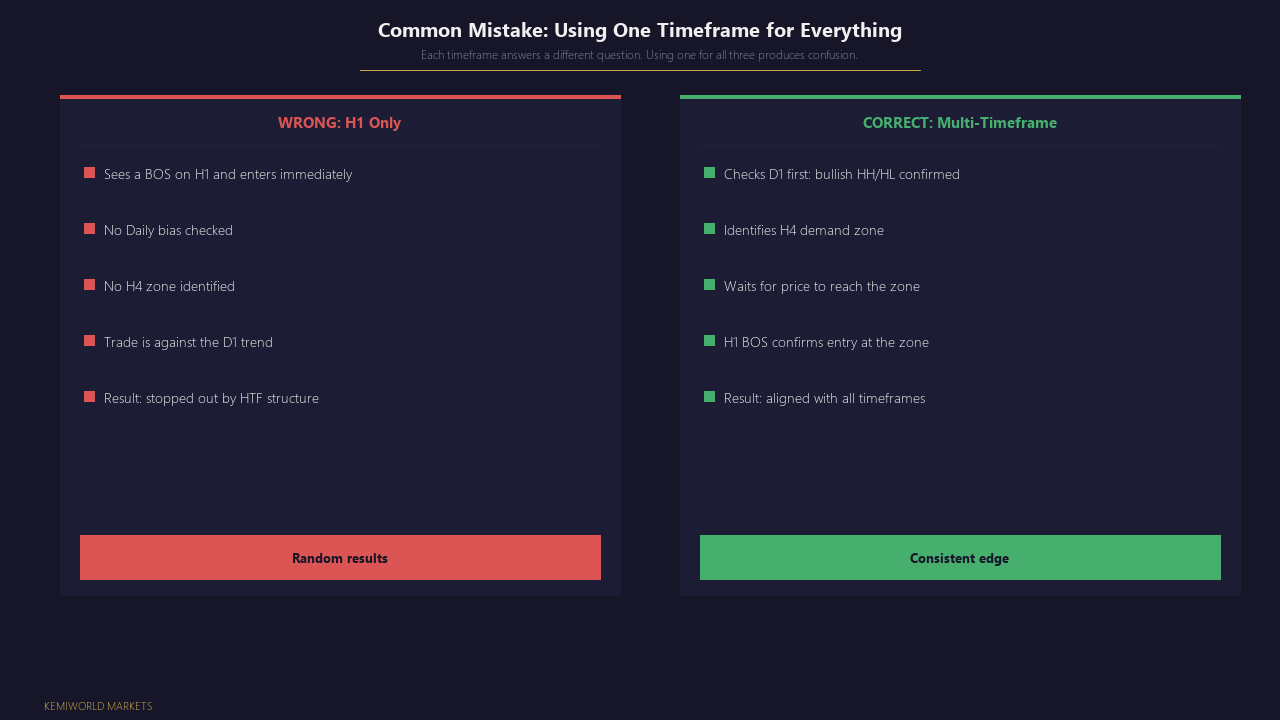
The Fatal Error: Using Only One Timeframe
A trader using only the H4 chart might see an H4 downtrend and short — without knowing they are entering against a weekly uptrend at a major weekly support zone. They get stopped out by the daily bullish reversal they could have seen if they had looked up.
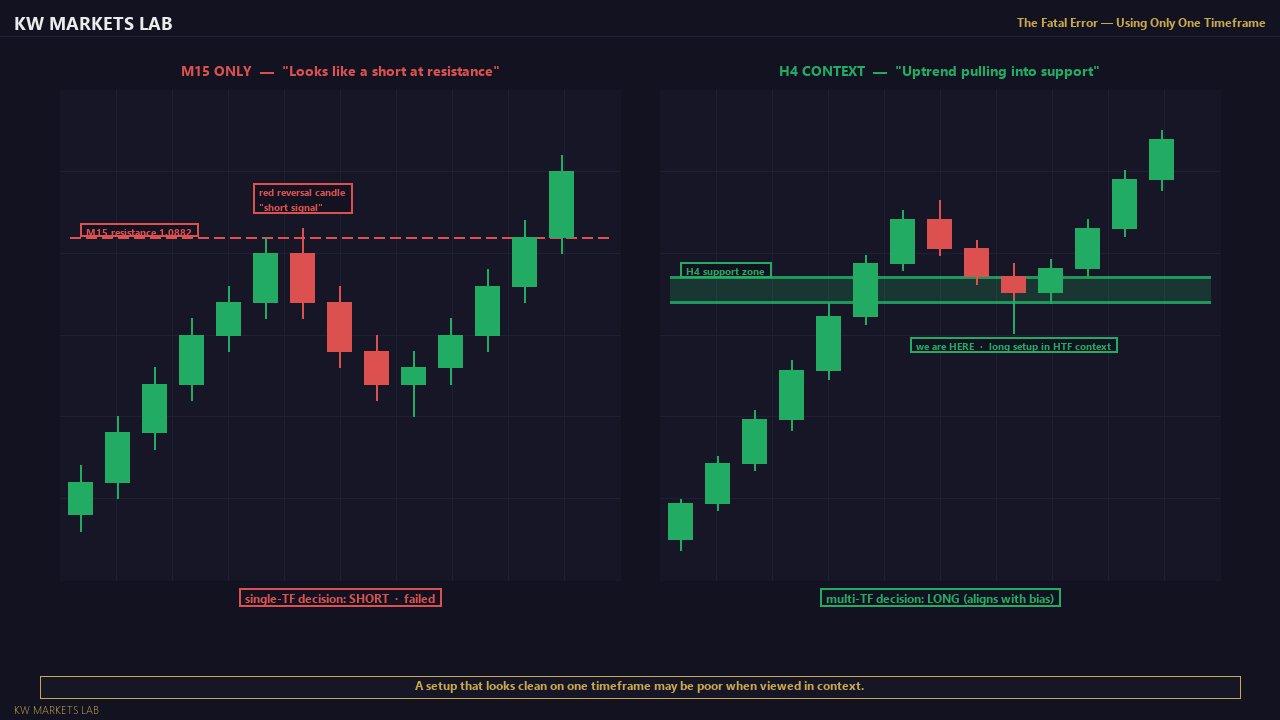
A trader using only the M15 chart might enter a short at an M15 resistance level — without knowing they are short in the direction of an M15 counter-trend move inside an H4 uptrend. The M15 resistance holds for two candles and then price breaks above it as the H4 trend resumes.
In both cases, the analysis was technically correct on the chosen timeframe. The error was not reading the context.
The multi-timeframe approach is not complicated. It takes an additional 2–3 minutes before an entry. The discipline is to never skip the higher timeframes when they are available to check.
A Common Confusion: "Which Timeframe Should I Trade?"
Beginners often ask which timeframe is "best." The answer depends on how much time you have available and how long you want to hold positions.
| Trading style | Primary analysis TF | Entry TF | Typical hold time |
|---|---|---|---|
| Position trading | Weekly / Daily | H4 | Days to weeks |
| Swing trading | Daily / H4 | H1 / M15 | Hours to days |
| Day trading | H4 / H1 | M15 / M5 | Minutes to hours |
| Scalping | H1 / M15 | M5 / M1 | Seconds to minutes |
This course focuses primarily on the swing and day trading range — Daily to M15. Scalping requires substantially faster execution and tighter risk management than this course addresses.
Whatever your trading style, the top-down principle applies: always consult at least one timeframe above your primary analysis timeframe before entering.
Common Mistakes
Dropping to a lower timeframe to find confirmation that the higher timeframe doesn't give. If the H4 chart does not confirm your bias, going to the M15 to find a bullish pattern and using that as justification is not multi-timeframe analysis — it is confirmation bias with extra steps.
Treating M15 patterns as equivalent to H4 patterns. A BOS on the 15-minute chart has much less significance than a BOS on the 4-hour chart. Always weight the signal by the timeframe it occurred on.
Using too many timeframes. Checking seven timeframes before an entry creates paralysis, not confidence. A practical framework needs three to four timeframes at most: high context, bias, entry zone, entry trigger.
Ignoring the higher timeframe after entry. Once in a trade, most traders focus only on the lower timeframe. But if the daily chart shows a major resistance zone at your target, that information matters for your exit — even if you entered from the M15.
Key Takeaways
- Each timeframe serves a specific role: context (Weekly/Daily), structure (H4), entry zone (H1), trigger (M15).
- Higher timeframes carry more weight. A daily zone outweighs an M15 zone.
- Never use a single timeframe for all decisions — you are missing essential context.
- Match your timeframe selection to your trading style and available screen time.
- Always check at least one level up before entering a trade.
Checkpoint Exercise
Take any open position you are considering (or a recent trade you took):
1. What does the Daily chart say about the trend direction?
2. What does the H4 chart say about the current swing structure within that trend?
3. What does the H1 chart say about the immediate approach to the entry zone?
4. What trigger did you (or would you) use on the M15?
If you cannot answer all four, the analysis is not complete.
Lesson Objective
By the end of this lesson, you should be able to state the specific purpose of the Weekly, Daily, H4, H1, and M15 timeframes in a structured analysis process, and explain why using a single timeframe for all decisions is a structural error.
Get notified when new lessons and content are published.