Course Outline — Lesson 4 of 22 ▼
L2.1 — Swing Highs, Swing Lows, and How to Identify Them
Swing Highs, Swing Lows, and How to Identify Them
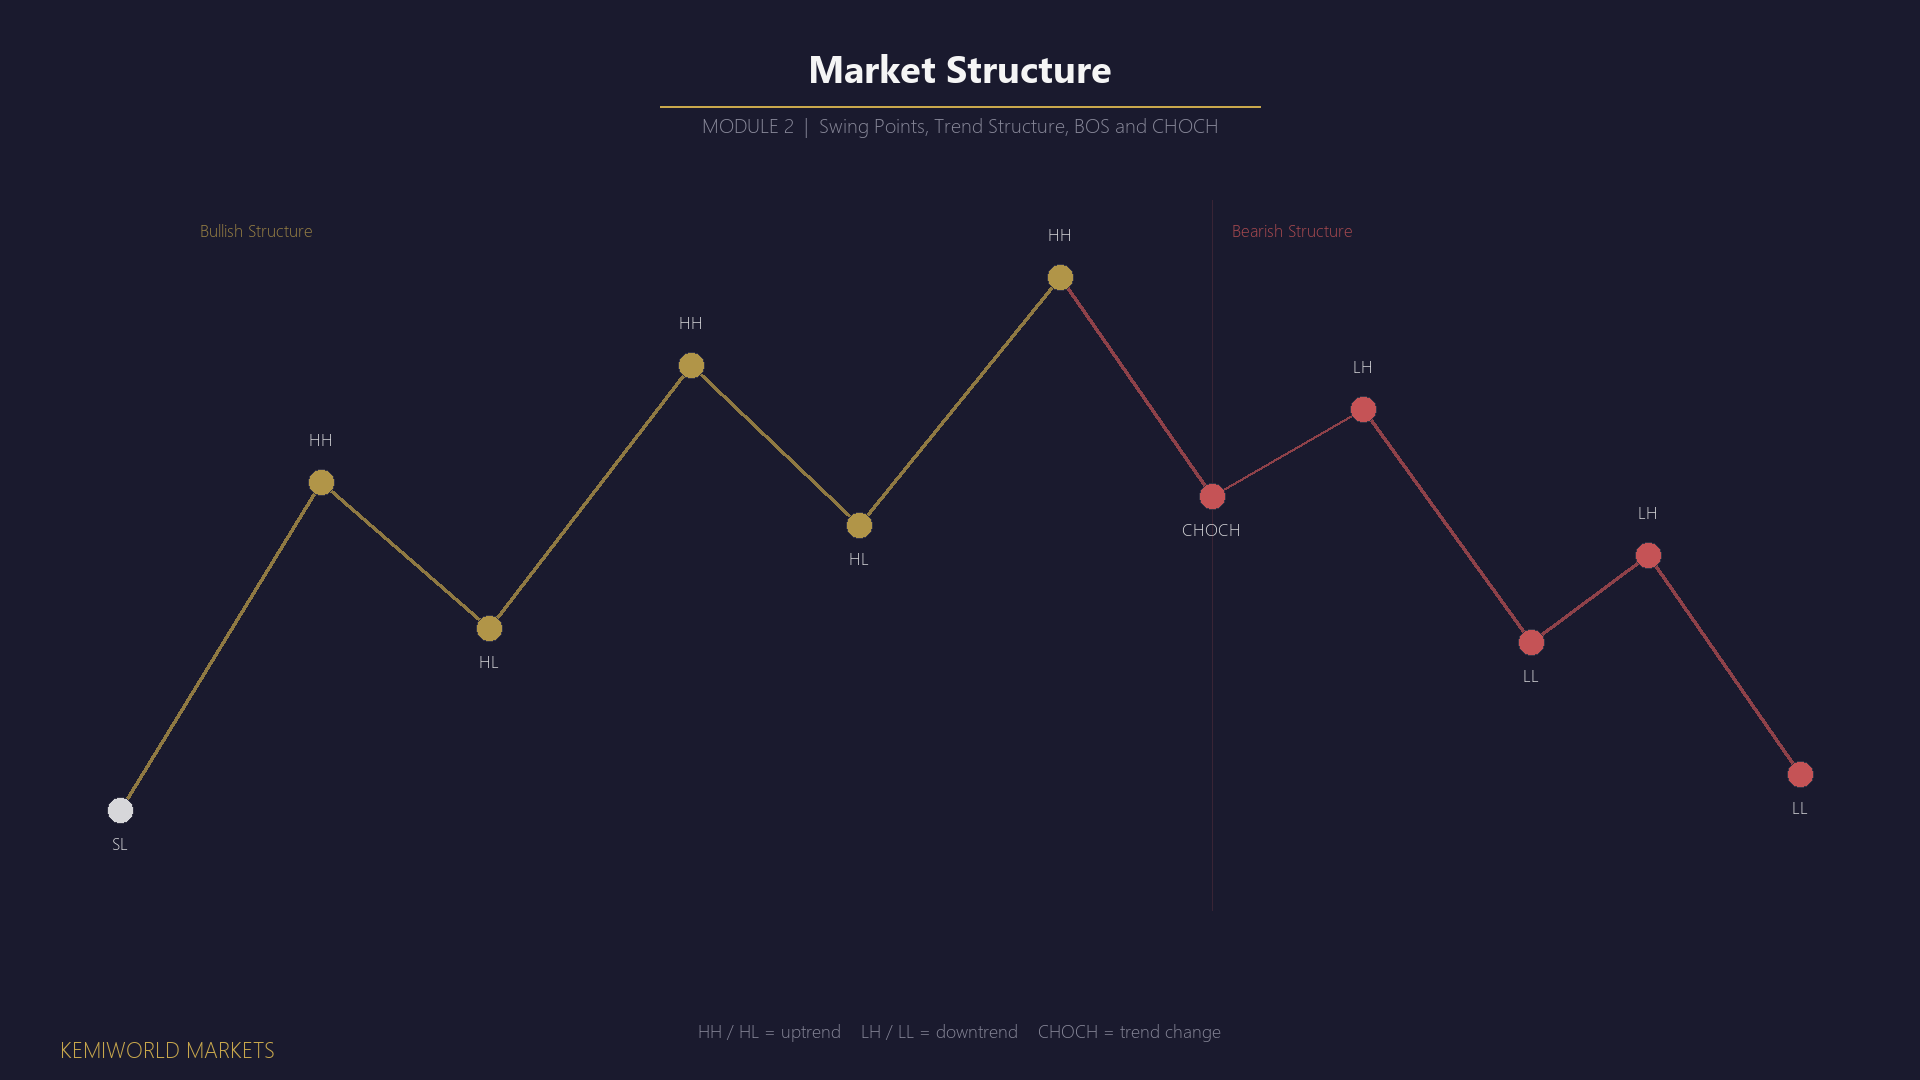
Market structure begins with a single skill: identifying swing highs and swing lows. These are the reference points from which all structural analysis is built. Without the ability to correctly identify them, every subsequent framework — trend identification, break of structure, key levels — has no foundation.
This lesson defines swing highs and swing lows precisely, explains how to distinguish significant from insignificant ones, and gives you a practical process for marking them on any chart.
What Is a Swing High?
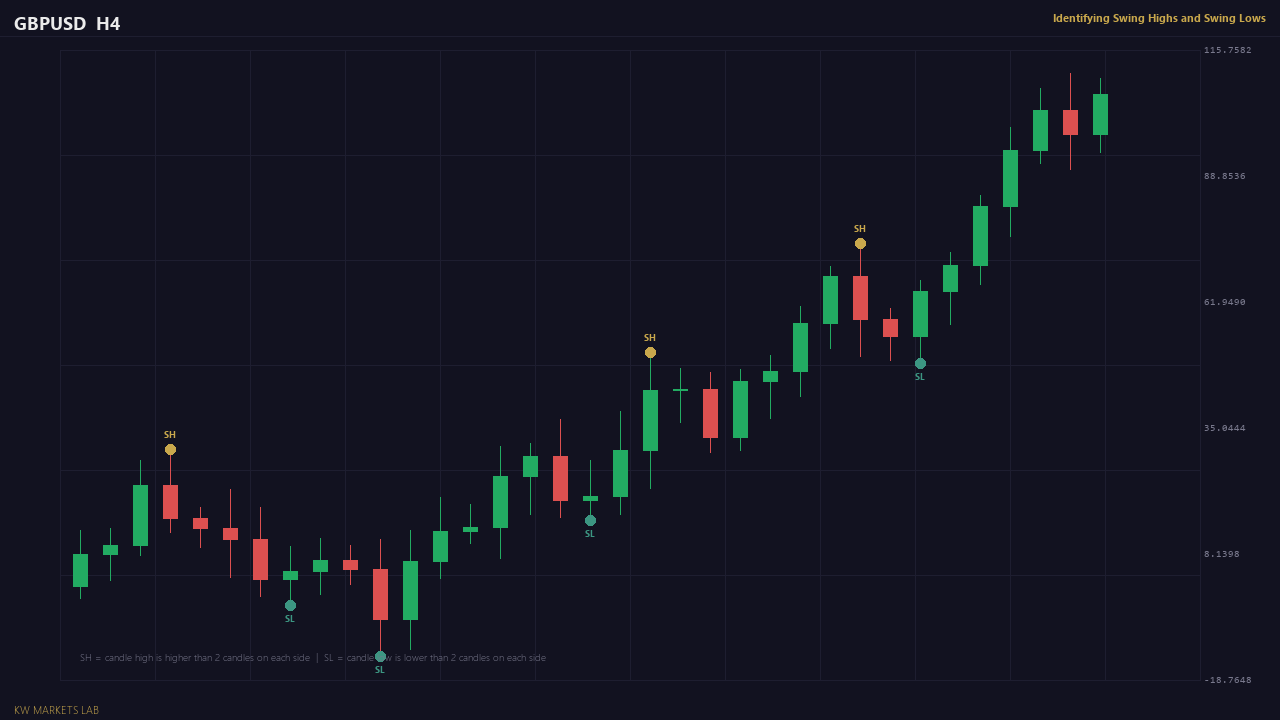
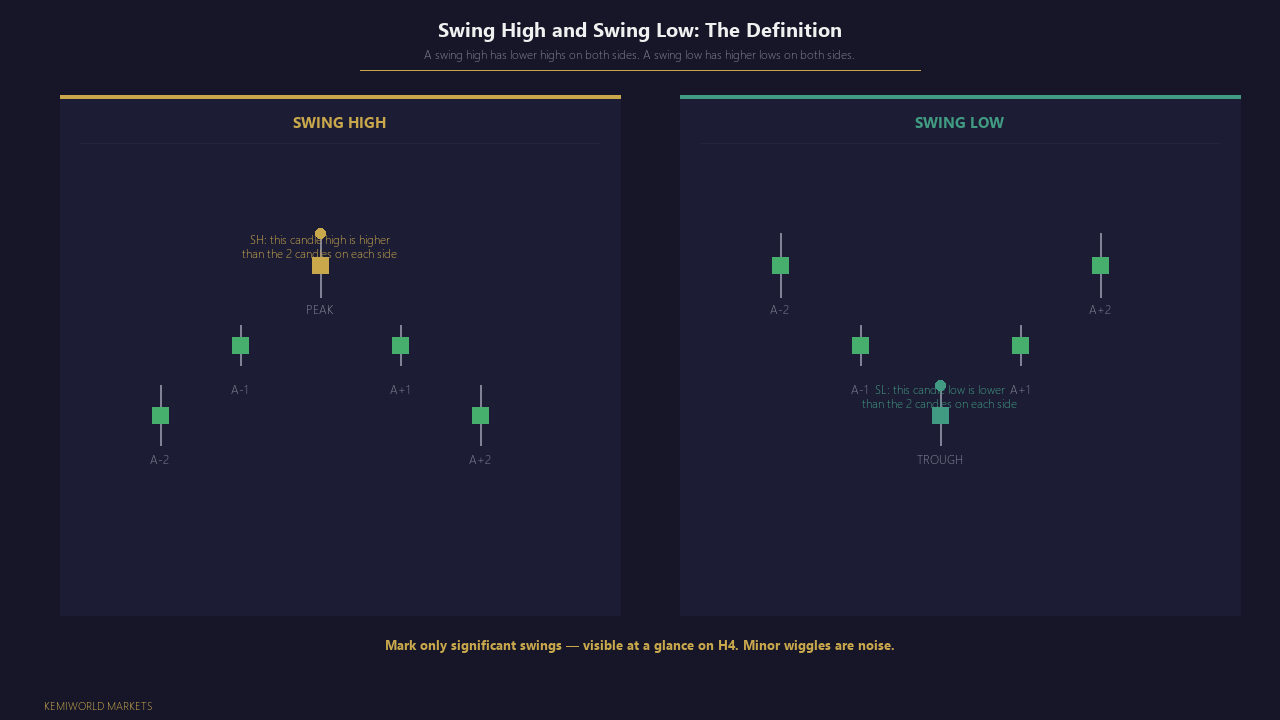
A swing high is a candlestick (or price bar) whose high is higher than the highs of the bars immediately on either side of it.
Formally: bar B is a swing high if the high of B is greater than the high of bar A (the bar before it) and greater than the high of bar C (the bar after it).
In plain terms: a swing high is a peak. Price reached a high, then pulled back from it. The pullback confirms that buyers ran out of momentum and sellers stepped in at that level.
On a chart, swing highs appear as visible turning points where price changed direction from upward to downward. The high of that turning candle is the swing high level.
What Is a Swing Low?
A swing low is a candlestick whose low is lower than the lows of the bars immediately on either side of it.
In plain terms: a swing low is a trough. Price fell to a low, then bounced from it. The bounce confirms that sellers ran out of momentum and buyers stepped in at that level.
On a chart, swing lows appear as visible turning points where price changed direction from downward to upward. The low of that turning candle is the swing low level.
Significant vs Insignificant Swings
Not every small turn in price is worth marking. On any chart, price makes dozens of minor fluctuations within a single session. Marking all of them produces a chart covered in lines that tell you nothing useful.
The key question is: does this swing point represent a meaningful shift in buying or selling pressure, or is it simply noise?
Several factors make a swing point significant:
The reaction is visible without zooming in. If you have to switch to a lower timeframe to see a swing point clearly, it is probably not significant on your current analysis timeframe.
The candle bodies are clear, not just wicks. A genuine swing high often shows a candle with a body that fails to make a new high — not simply a wick that briefly exceeded a previous level and returned immediately.
The reaction leads to a directional move, not a sideways drift. A meaningful swing low is followed by a purposeful upward move, not a few candles drifting sideways. The reaction confirms that the level mattered.
A practical rule: when starting out, aim to identify no more than four or five major swing points across the visible portion of your chart. If you are marking more than that, you are likely marking noise.
The Relationship Between Swing Points and Candle Wicks
One of the most common errors is confusing wick-based extremes with structural swing points.
A wick that briefly exceeds a prior high but has a candle body that closed well below it is often a liquidity sweep rather than a structural swing high. The high of the wick is a real price level (stops and orders sit there), but the candle's rejection of that level — closing below it — may mean the swing high reference for structural analysis is the body close, not the wick tip.
Different traders handle this differently. For simplicity in this course: use the wick high/low as the level, but require the candle body to have clearly reversed direction away from that level before labelling it as a swing point. A wick that briefly exceeds a level and returns with a strong body is a stronger swing confirmation than a single weak candle.
How to Mark Swing Points in Practice
When you open a chart to analyse, follow this sequence:
- Set your timeframe (start with the Daily or H4 for structural analysis).
- Look at the most recent 20–30 candles visible on screen.
- Identify the clearest peaks (swing highs) — the points where price turned visibly from up to down.
- Identify the clearest troughs (swing lows) — the points where price turned visibly from down to up.
- Mark only the most significant four or five on each side.
- Do not mark every minor fluctuation.
These marked points are your structural reference framework. In the next lesson, you will use them to determine trend direction. After that, you will use them to identify structural breaks.
Lesson Summary
- A swing high is a price bar whose high exceeds the bars on either side — a visible turning point from up to down.
- A swing low is a price bar whose low is below the bars on either side — a visible turning point from down to up.
- Not every turn is significant. Mark only the clear, directional turning points.
- Four or five significant swing points across the visible chart is usually sufficient for analysis.
Lesson Objective
By the end of this lesson, you should be able to open any chart on the Daily or H4 timeframe and correctly identify and mark the four or five most significant swing highs and swing lows visible, distinguishing them from minor noise and wick-only extremes.
Try This
Open your trading platform and pull up any chart — EURUSD, XAUUSD, or any instrument you follow. Set it to the H4 timeframe.
Working left to right across the last 30–50 candles:
- Find what you believe is the most recent clear swing high — a candle peak with lower candles on both sides
- Find the most recent clear swing low — a candle trough with higher candles on both sides
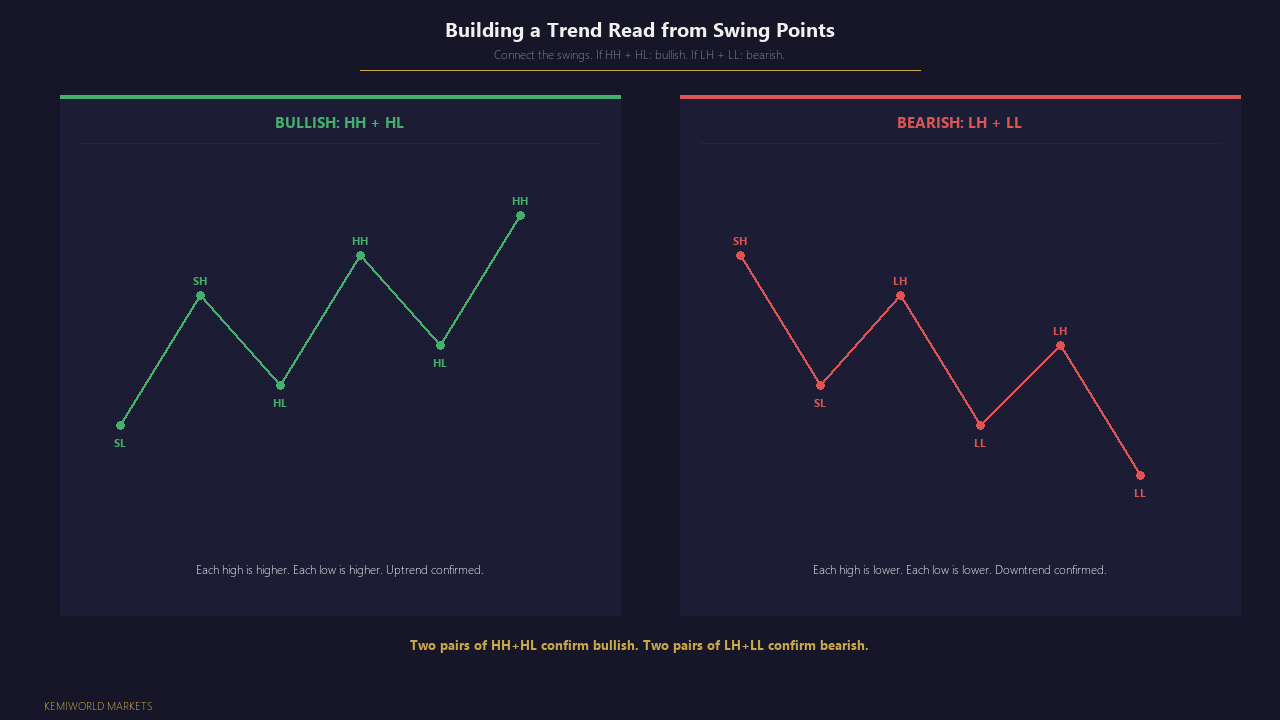
- Ask: is the overall sequence making higher swing highs and higher swing lows, or lower?
Do not worry about whether you have found the "right" swings. The point is to practise the observation — to look at a real chart and attempt the reading. You will find ambiguous candles. Note where you are uncertain. That uncertainty is exactly where analysis becomes most valuable.
No trade required. No right answer required. Just the observation.
Get notified when new lessons and content are published.