Course Outline — Lesson 15 of 22 ▼
L6.1 — The Maths of Risk: Why Percentages Matter More Than Pips
The Maths of Risk: Why Percentages Matter More Than Pips
This is the most important module in the course. Not because it is the most technically complex — it is not. But because getting risk management wrong ends trading careers, and most traders who fail do not fail because they could not read a chart. They fail because they were risking too much per trade, on too many trades, without a defined framework to stop the bleeding.
This lesson does not assume you have been trading for long. It assumes you want to build correctly from the beginning.
Why Pips Are a Misleading Metric
When traders talk about a trade result, they usually say things like: "I made 40 pips" or "I lost 30 pips." This is an understandable shorthand, but it obscures the information that actually matters: how much capital was at risk?
Pips tell you the distance price moved. They do not tell you the financial impact. The same 30-pip loss means:
- £30 on a mini lot of EURUSD (at a pip value of £1/pip)
- £300 on a standard lot of EURUSD (at a pip value of £10/pip)
- A different amount again on a different instrument, because pip values vary
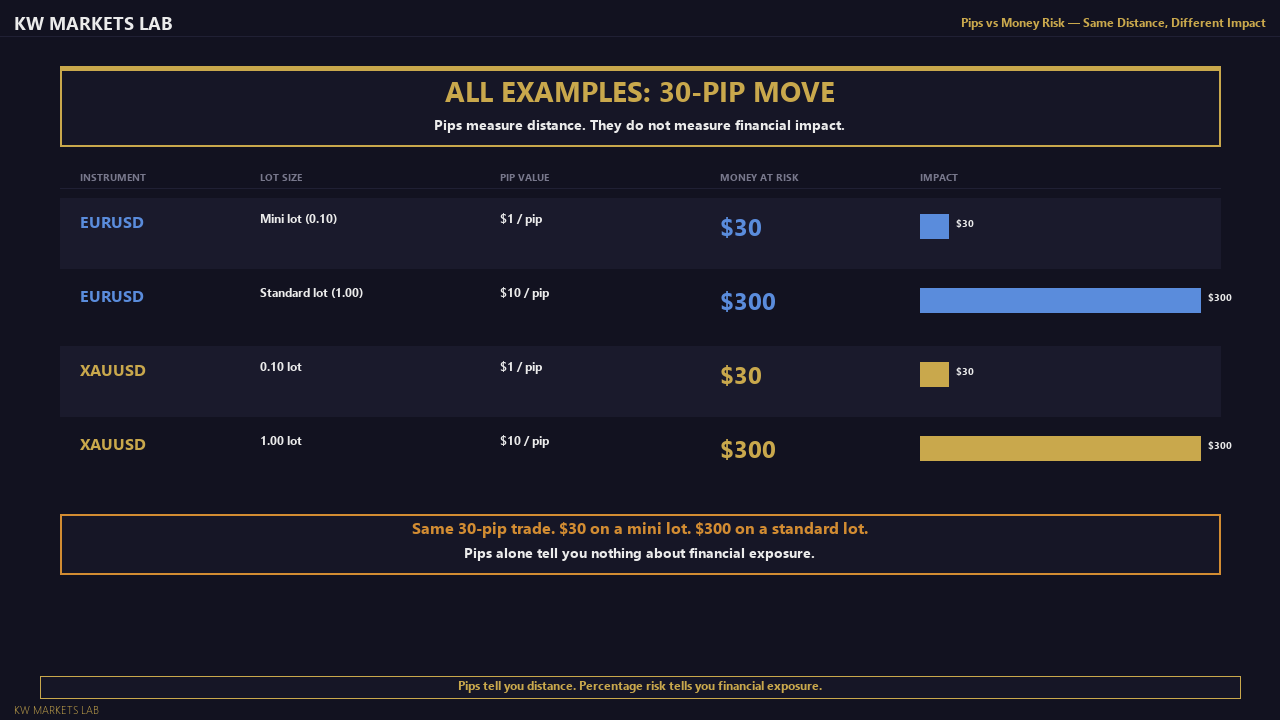
On gold (XAUUSD), "pips" are typically counted differently — a $1 move in gold = 100 pips in broker notation, or simply quoted as $1.00. A "30-pip" stop on gold is $0.30 per 0.01 lot — almost nothing. A "$30 stop" is something very different.
The only way to compare trade results, losses, and progress across instruments, account sizes, and time periods is to express everything as a percentage of account equity.
The Percentage Risk Framework
Risk per trade = the percentage of your account equity you are willing to lose if the trade hits its stop loss.
This is a decision made before the trade. It is not the outcome — it is the maximum acceptable loss if you are wrong.
Examples:
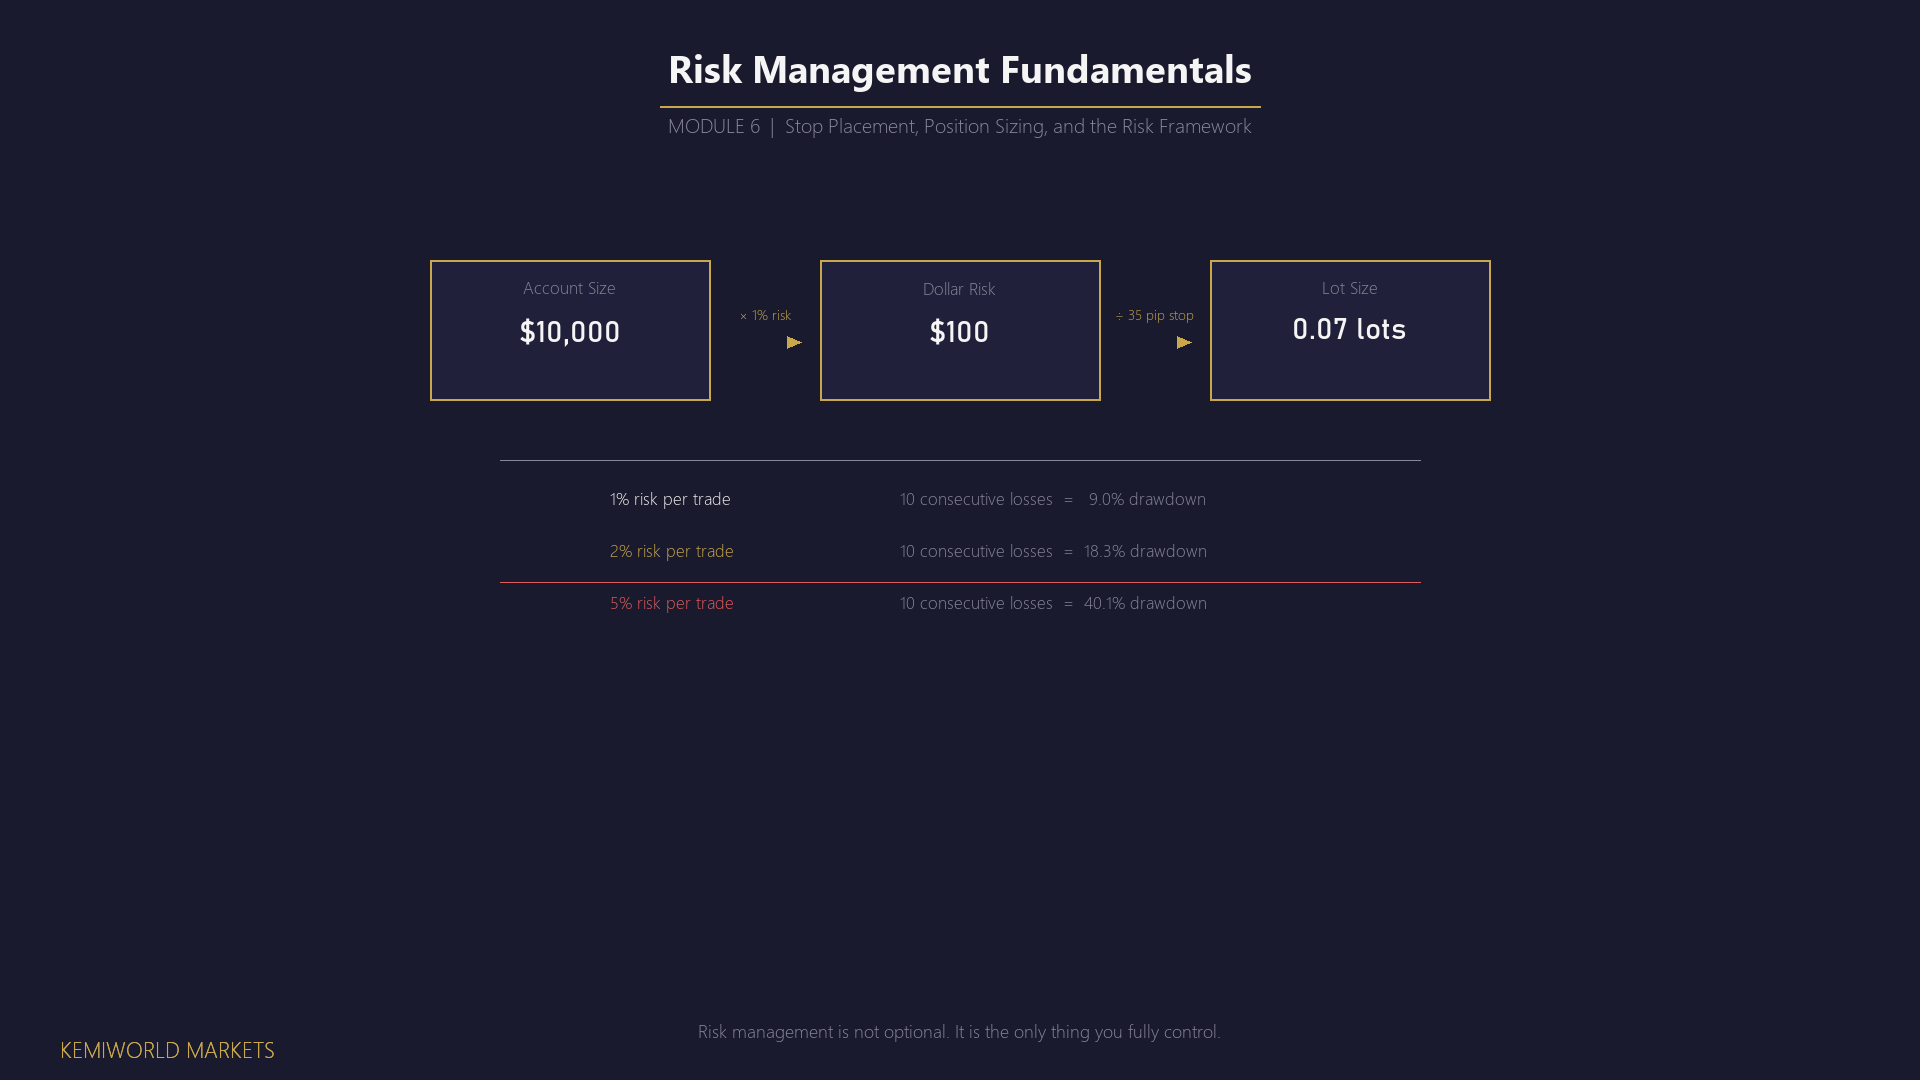
- $10,000 account, 1% risk per trade = $100 maximum loss
- $5,000 account, 1% risk per trade = $50 maximum loss
- $10,000 account, 2% risk per trade = $200 maximum loss
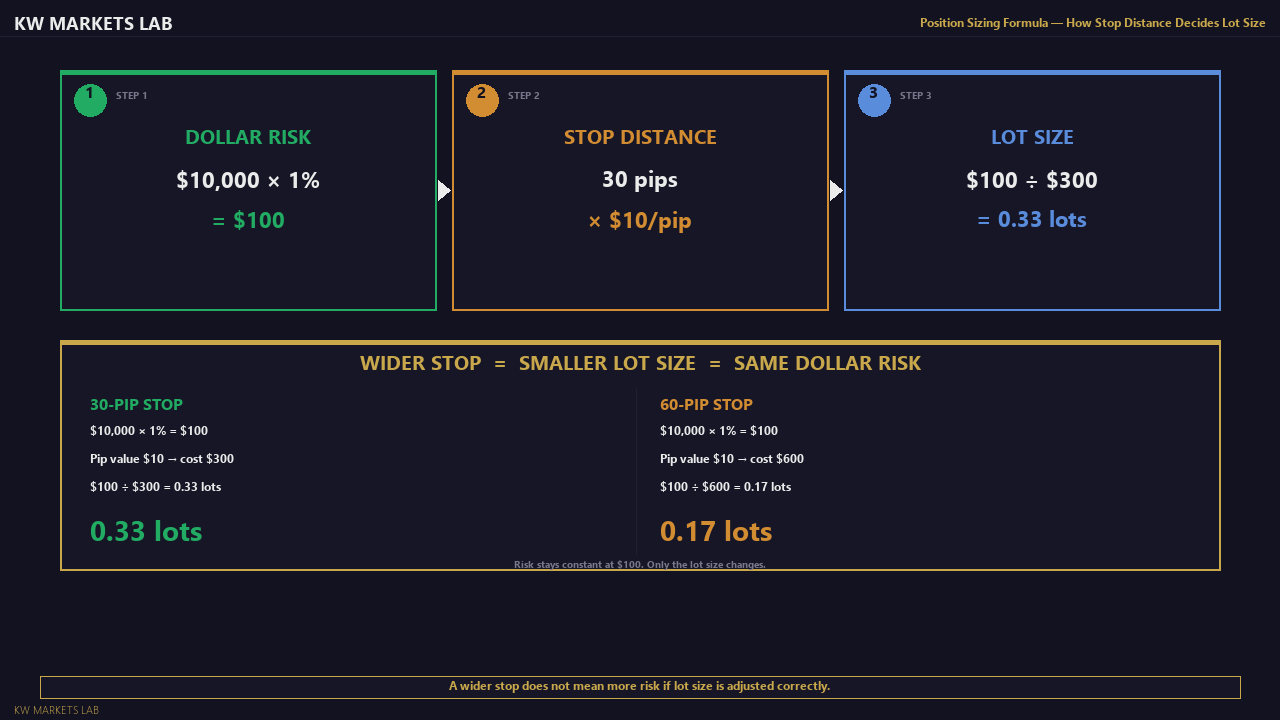
This figure ($100, $50, $200) is then used to calculate position size. The calculation is covered in L6.3. For now, understand that percentage risk is the input — everything else (lot size, position size) is derived from it.
The most commonly cited professional standard is 1–2% maximum risk per trade. Some conservative frameworks use 0.5%. Very few systematic traders risk more than 2% per trade on any single position.
Why? Because of what the maths of losing looks like.
The Maths of Losing: Why the Risk of Ruin Is Real
Consider two traders, both with a $10,000 account and a 40% win rate — meaning 4 out of every 10 trades win and 6 lose. This is realistic. Many profitable strategies have win rates below 50%.
Trader A risks 1% per trade ($100).
Trader B risks 5% per trade ($500).
Assume both have average winners equal to 1.5× their average losers (a 1:1.5 risk:reward ratio). Over 20 trades (8 wins, 12 losses):
| Trader A (1% risk) | Trader B (5% risk) | |
|---|---|---|
| Total won (8 × $150) | +$1,200 | +$6,000 |
| Total lost (12 × $100) | −$1,200 | −$6,000 |
| Net result | Breakeven | Breakeven |
So far the same in expectancy terms. But now consider what happens during the worst losing streak within those 20 trades — say, 6 consecutive losses (not unusual at a 40% win rate):
| Trader A | Trader B | |
|---|---|---|
| Losses (6 × risk) | −$600 | −$3,000 |
| Account after streak | $9,400 | $7,000 |
| % drawdown | 6% | 30% |
Trader B is at a 30% drawdown after a perfectly normal losing streak at a 40% win rate. To recover to $10,000 from $7,000, Trader B needs a 43% gain on the reduced account — a much harder task than the gains that caused the drawdown.
Now extend this further: if Trader B's strategy has a period of underperformance (as all strategies do), and the win rate drops to 25% for 30 trades, the probability of a losing streak of 8–10 consecutive trades is meaningful. At 5% risk per trade, 10 consecutive losses = 40% drawdown. Recovery from 40% requires a 67% gain.
The asymmetry of losses:
- 10% loss requires 11% gain to recover
- 20% loss requires 25% gain to recover
- 40% loss requires 67% gain to recover
- 50% loss requires 100% gain to recover
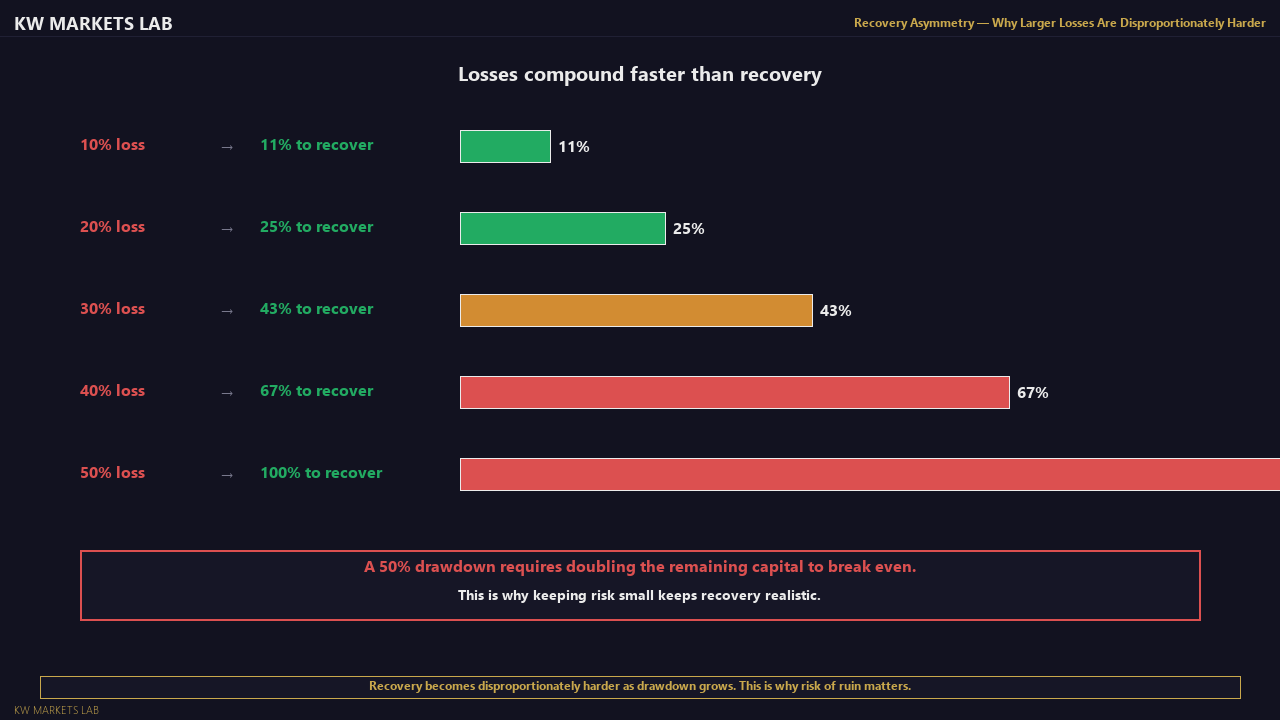
This is the risk of ruin in practical terms: not the probability of losing your entire account in one trade, but the slow accumulation of drawdown that eventually makes recovery statistically improbable.
Keeping risk at 1–2% per trade keeps individual losing streaks survivable and recoverable.
The Effect of Position Sizing on Account Longevity
Another way to see this: how many consecutive losses does it take to lose 20% of the account?
| Risk per trade | Consecutive losses to reach 20% drawdown |
|---|---|
| 0.5% | 44 losses |
| 1% | 22 losses |
| 2% | 11 losses |
| 5% | 4 losses |
| 10% | 2 losses |
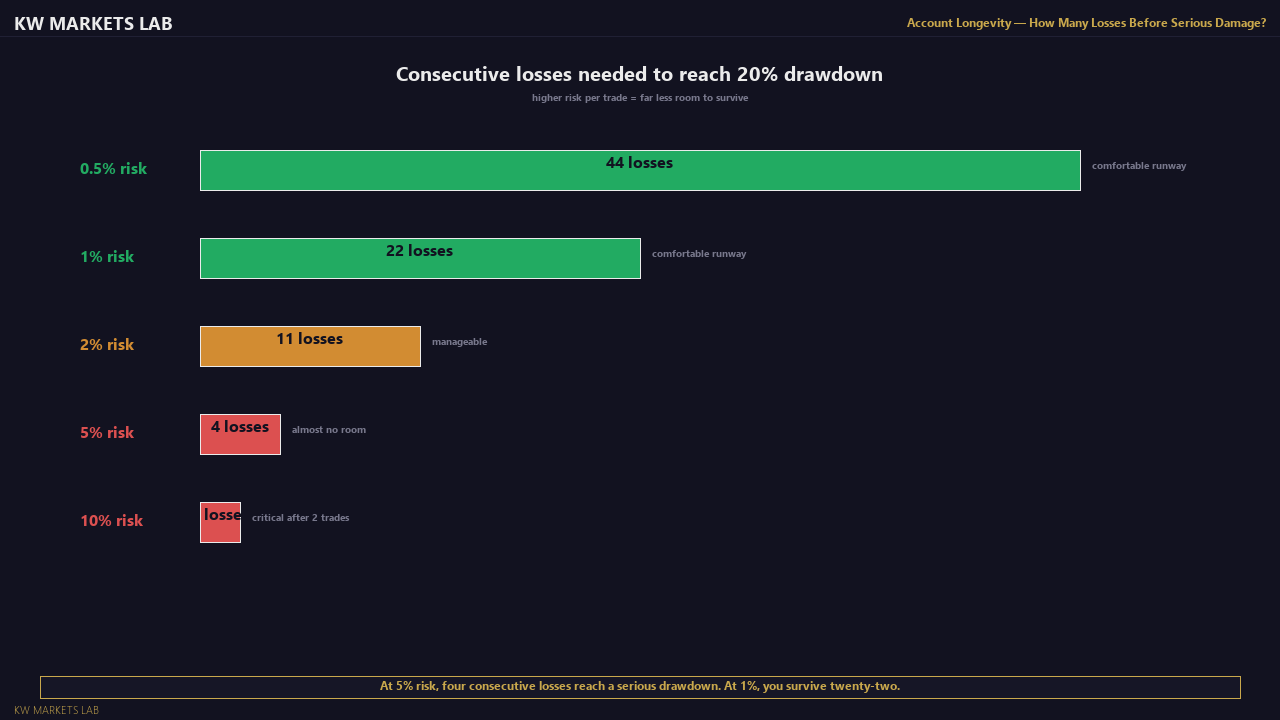
At 5% risk, four consecutive losses put you in a significant drawdown. At a 40% win rate, four consecutive losses is not rare — it happens regularly. At 1% risk, 22 consecutive losses are required to reach the same point. Even at a poor win rate, 22 consecutive losses is an extreme outlier that allows ample time to review your process before the drawdown becomes critical.
The Compounding Effect of Losses at Different Risk Levels
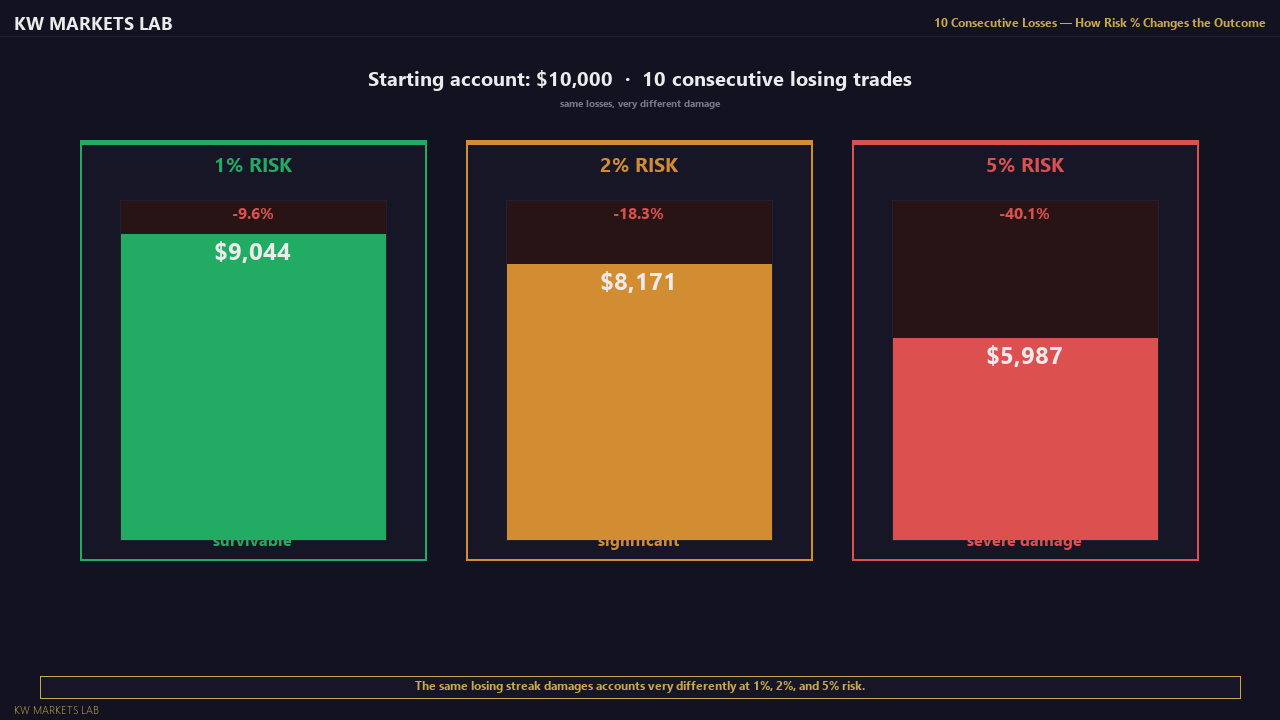
The table below shows the account balance remaining after 10 consecutive losing trades, starting from $10,000, at three different risk levels. These numbers are exact.
| Risk per trade | After 10 consecutive losses | Account remaining | Loss |
|---|---|---|---|
| 1% | $10,000 × 0.99¹⁰ | $9,044 | −$956 |
| 2% | $10,000 × 0.98¹⁰ | $8,171 | −$1,829 |
| 5% | $10,000 × 0.95¹⁰ | $5,987 | −$4,013 |
The 1% trader has lost less than 10% after ten consecutive losses — still in a recoverable position, still able to trade with a clear head. The 5% trader has lost more than 40% of their account. Ten consecutive losses is not an extreme outlier at a 40–45% win rate. It will happen.
The emotional impact matters too. A 40% drawdown creates severe psychological pressure that leads to the exact behaviour — oversizing, revenge trading, rule-breaking — that accelerates the loss further.
What 1% Risk Feels Like (and Why It Seems Too Small)
One of the most common psychological reactions to this framework is: "But $100 on a $10,000 account feels like nothing. That's not worth trading."
This reaction reflects a mismatch between expectations and realistic return profiles. Consider:
- If your strategy generates 100 trades per year with a 1:2 risk:reward and a 45% win rate, your expectancy is approximately +0.4R per trade (R = risk unit)
- Over 100 trades: +40R per year
- At 1% risk ($100 per trade): +$4,000 per year on a $10,000 account = 40% annual return
- At 2% risk ($200 per trade): +$8,000 per year = 80% annual return
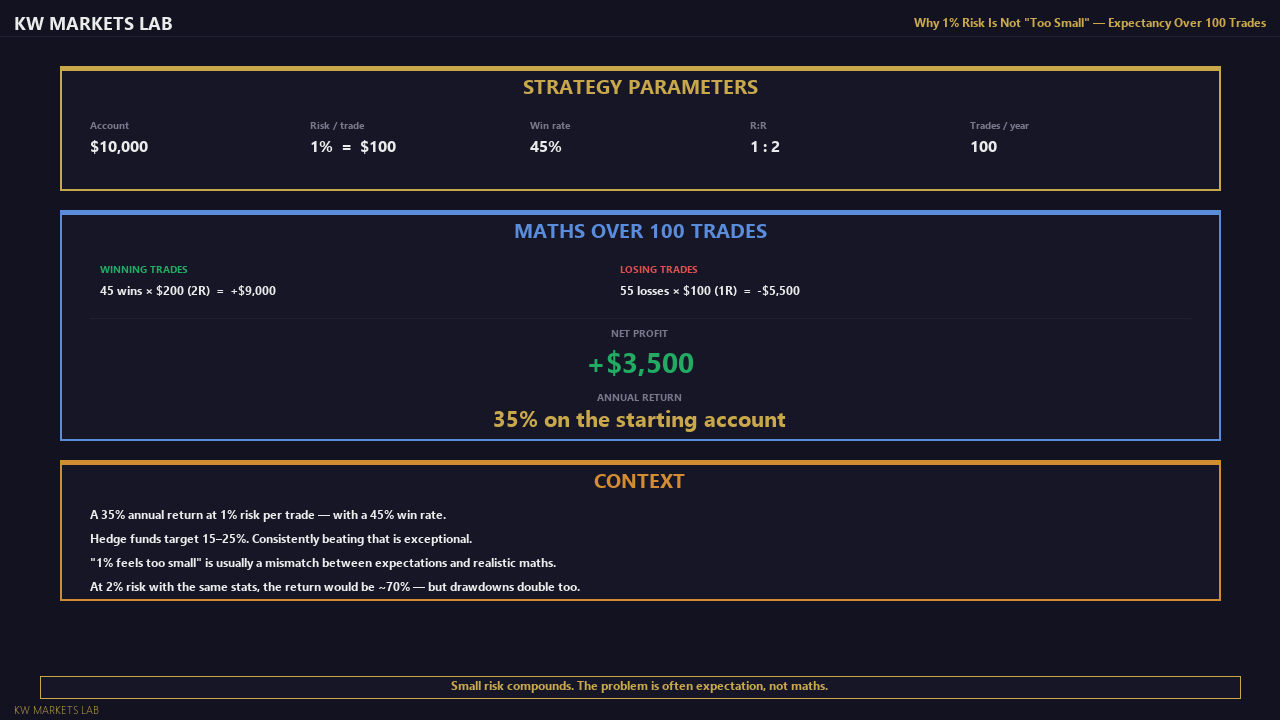
A 40–80% annual return is exceptionally good by any professional standard. The feeling that "1% is too small" is a symptom of expecting returns that are not realistic for systematic trading, not a reflection of reality.
Common Mistakes
Risking different percentages on different trades based on "conviction." Conviction is not a quantifiable input. High-conviction trades still hit their stop losses regularly. Consistent percentage risk removes the emotion of sizing up on trades that "feel better."
Calculating risk based on lot size, not account equity. "I always trade 0.1 lots" is not a risk management framework. 0.1 lots on a $500 account is 20% risk. On a $50,000 account, it is 0.2% risk. Lot size must be calculated from account equity and defined risk percentage.
Not accounting for spread in stop distance. If your stop is 20 pips and the spread is 3 pips, your effective risk is 23 pips. Factor spread into your loss calculation when sizing positions.
Adjusting risk percentage after a winning streak. Increasing position sizes after a run of wins is a common behavioural trap — it exposes you to the maximum drawdown at exactly the moment when a reversion in performance is statistically most likely.
Key Takeaways
- Pips measure distance. Percentage of account equity measures risk. Only the latter is consistent across instruments, account sizes, and time.
- 1–2% maximum risk per trade is the most widely cited professional standard. Reasons are mathematical, not arbitrary.
- The asymmetry of losses means that larger drawdowns require disproportionately larger gains to recover.
- At 1% risk, even 22 consecutive losses only produce a 20% drawdown — survivable and reviewable.
- The feeling that 1% is "too small" typically reflects unrealistic return expectations, not a flaw in the framework.
Checkpoint: Risk Maths Exercise
- You have a $7,500 account. You risk 1.5% per trade. What is your maximum loss in dollars on the next trade?
- A trader with a $20,000 account risks 4% per trade. They have 5 consecutive losses. What is their account balance? What percentage gain do they need to recover to $20,000?
- Your strategy has a 42% win rate and a 1:2 risk:reward ratio. Over 50 trades, what is your theoretical net outcome in R? (Wins: 42% × 50 = 21 wins × 2R = +42R. Losses: 58% × 50 = 29 losses × 1R = −29R. Net = +13R.)
Work these out without a calculator first, then verify.
Lesson Objective
By the end of this lesson, you should be able to explain why percentage risk is more meaningful than pip count, calculate account risk in dollar terms for any given percentage, and explain the asymmetry of losses and why 1–2% per trade is the most commonly cited professional standard.
Get notified when new lessons and content are published.