Course Outline — Lesson 12 of 22 ▼
L4.3 — Top-Down Analysis: Building a Bias Before You Touch the Chart
Top-Down Analysis: Building a Bias Before You Touch the Chart
Every framework in this course — market structure, key levels, session timing, timeframe selection — is a building block. Top-down analysis is how you assemble them into a coherent decision-making process.
The phrase "top-down" is literal: you start at the highest relevant timeframe and work downward, gathering progressively more specific information at each level, until you arrive at the lowest timeframe — where you decide whether a trade is valid or not.
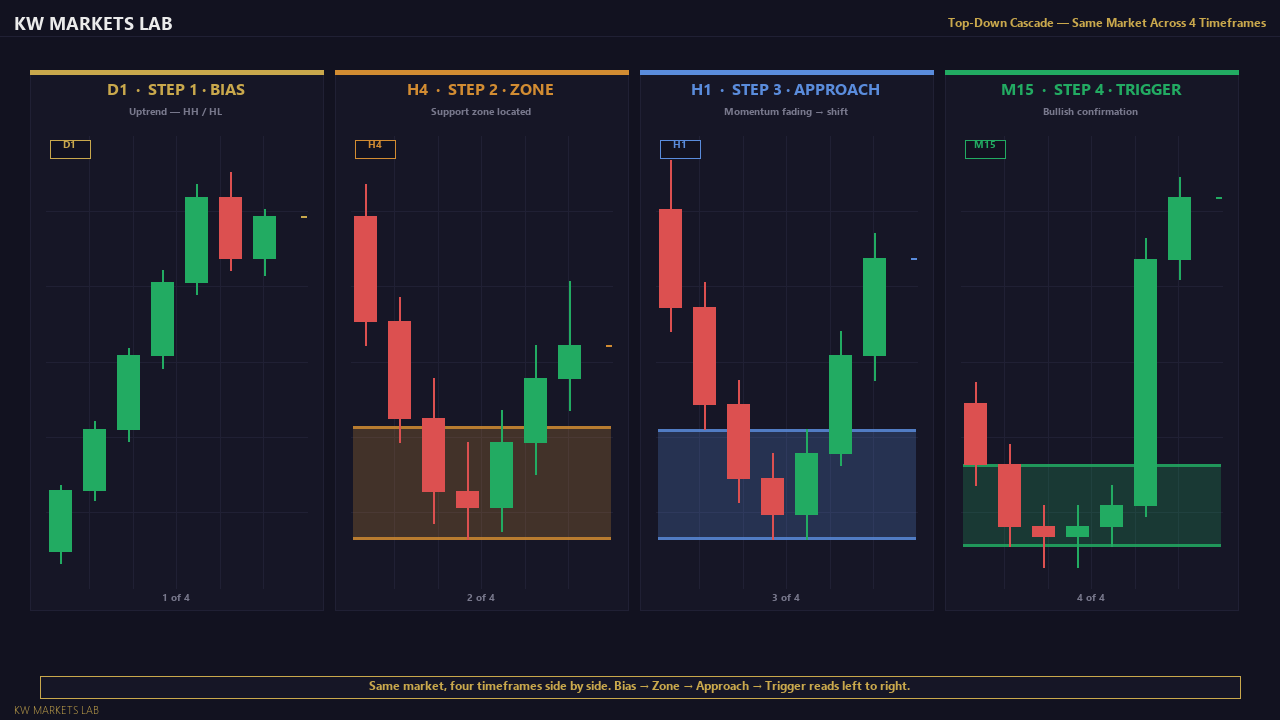
The Top-Down Analysis Process: Step by Step
The process below uses Daily → H4 → H1 → M15. Adjust timeframes for your trading style.
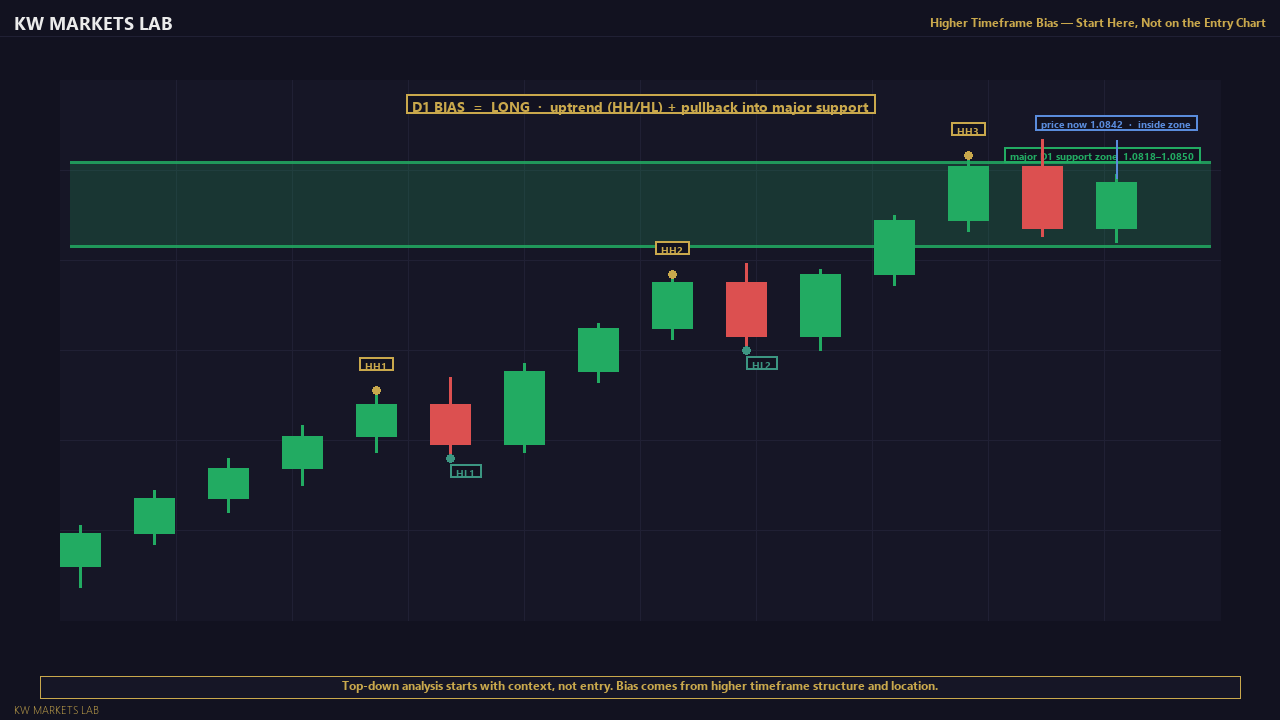
Step 1: Weekly / Daily — Establish the Directional Bias
Question to answer: What is the dominant trend, and what direction should I be looking to trade?
Actions:
- Identify the current trend structure using HH/HL or LH/LL (from M2).
- Mark the two or three most significant structural zones on this timeframe (from M3).
- Mark any major psychological levels near the current price (from L3.2).
- Mark PDH/PDL and PWH/PWL (from L3.3).
- State your bias: bullish, bearish, or no bias (ranging / unclear).
If the daily chart gives you a clear bias, proceed. If it is clearly ranging or in a structural transition (recent CHOCH, price between two major zones), the probability of a clean directional trade is lower. Note this.
Step 2: H4 — Locate the Entry Zone
Question to answer: Within the daily trend, where is price now, and where is the logical area to look for an entry?
Actions:
- Identify the H4 structural condition: is it trending in alignment with the daily bias, pulling back, or in a counter-trend move?
- If aligned: confirm the most recent swing point (the last HL in a daily uptrend on the H4 chart). This area — the pullback zone — is where you will look for entries.
- If pulling back against the daily bias: watch for the H4 CHOCH that would signal the pullback is ending and the daily trend is resuming.
- Mark the H4 entry zone — the area between the last H4 HL and the previous H4 HH.
At the end of this step, you should have a specific price area — the entry zone — within which you will look for a trigger.
Step 3: H1 — Confirm Approach and Momentum
Question to answer: Is price currently approaching the entry zone? With what momentum? Is structure on H1 aligned?
Actions:
- Confirm price is within or approaching the H1 entry zone identified at Step 2.
- Read the H1 structure: is price creating the structural conditions for a valid entry? (e.g., a small H1 CHOCH near the H4 support zone that signals sellers are running out of momentum)
- Assess momentum: is price approaching the zone with a strong impulsive move (suggests it may overshoot) or a slow corrective drift (suggests exhaustion is near)?
If price is far from the entry zone: there is nothing to do. Wait. Do not lower your timeframe to find a reason to enter.
Step 4: M15 — Identify the Entry Trigger
Question to answer: Is there a specific, confirmed, rule-based trigger to enter right now?
Actions:
- Wait for your defined trigger pattern to form at the entry zone. Examples:
- A M15 BOS in the direction of the daily trend after a pullback to the H4 support zone
- A M15 rejection candle (strong wick + body reversal) at the H4 entry zone
- A M15 CHOCH followed by a structural re-entry in the direction of the daily bias
- Confirm the trigger is at the right place (within the entry zone, not far from it).
- Set the stop loss behind the appropriate structure (below the M15 swing low for a long, above the M15 swing high for a short).
- Calculate the lot size from your risk % and the stop distance (covered fully in M6).
- Confirm the risk:reward is acceptable before entering.
If no trigger forms at the zone: no trade. Do not force an entry.
What "Confluent Timeframes" Means
The phrase "confluence" appears throughout this course. In the context of top-down analysis, it means that multiple independently-derived pieces of evidence point toward the same conclusion.
An entry with strong confluence might look like:
- Daily chart: bullish structure (HH/HL), price has pulled back to a daily S/R zone
- H4 chart: H4 CHOCH just occurred at the daily support zone, suggesting the pullback is ending
- H1 chart: H1 structure has turned bullish after the H4 CHOCH
- M15 chart: entry trigger forms at a key M15 level with a clear bullish candle
- The entry zone also aligns with a major psychological level and the previous week's low
Five independent reasons to be long, all pointing at the same area, at the same moment. That is high confluence.
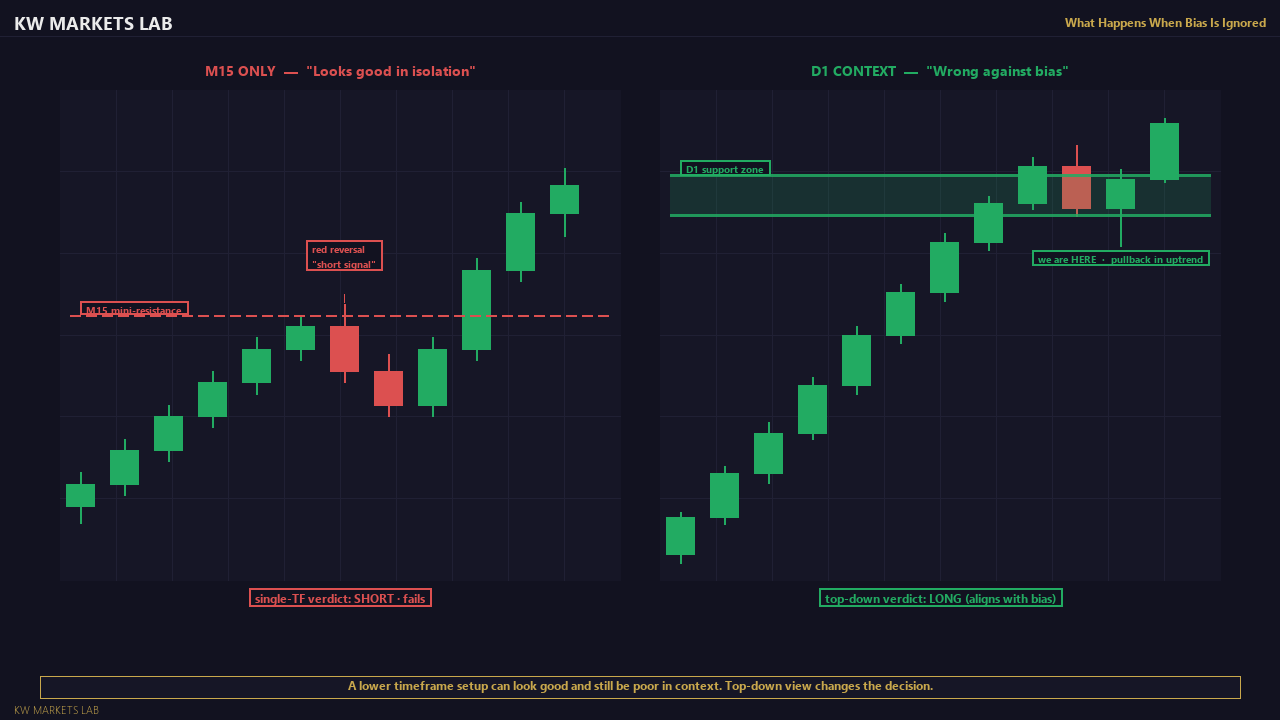
A low-confluence entry is one where only the M15 trigger exists, with little support from higher timeframes. These can win, but they are statistically lower quality and should carry smaller position sizes if taken at all.
What "Conflicting Timeframes" Means
Conflicting timeframes are the inverse: evidence pointing in different directions on different levels.
Example: H4 uptrend and H1 downtrend with price in the middle of a major range on the daily chart, approaching a daily resistance from below. Should you be long because of the H4 trend or short because of the H1 structure? The daily resistance and range context suggest neither bias is clearly favoured.
The answer: when timeframes genuinely conflict, the quality of any trade drops significantly. The appropriate response is to reduce position size, tighten criteria, or pass the trade entirely. Forcing a decision into a conflicting picture is not analysis — it is gambling with an analytical justification attached.
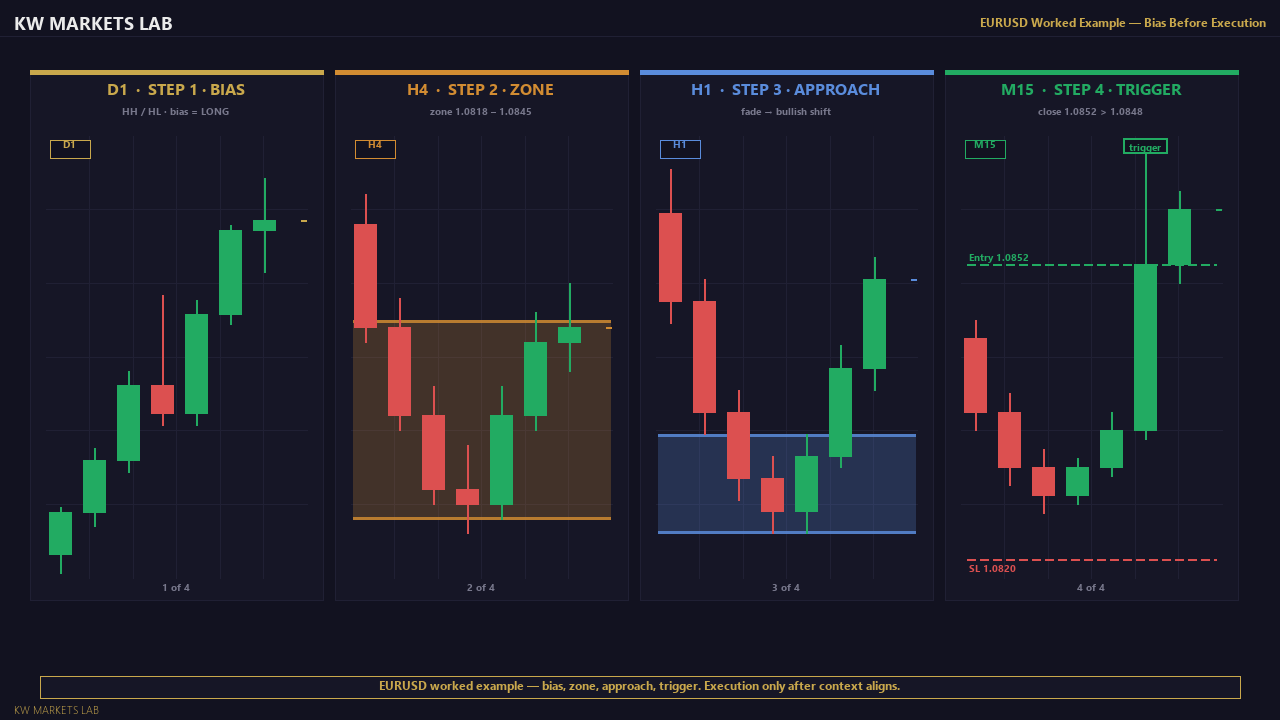
Worked Example: A Full Top-Down Walkthrough on EURUSD
This example shows the four-step process applied to a hypothetical EURUSD scenario. The specific prices are illustrative — apply the same logic to any current chart.
Scenario: You sit down to trade during the London session. EURUSD is at 1.0842.
Step 1 — Daily chart: Establish the directional bias
You open the Daily chart. You can see:
- A clear sequence of higher highs and higher lows over the past six weeks. The most recent confirmed HL is at 1.0755.
- Price has pulled back from the most recent HH at 1.0920 and is sitting near a Daily S/R zone between 1.0820 and 1.0845 — a level where price previously consolidated before the last rally.
- The previous week's low (PWL) is at 1.0808.
Daily bias: bullish. You are looking for long setups only.
Step 2 — H4 chart: Locate the entry zone
On the H4 chart:
- Structure is also showing HH/HL, aligned with the Daily bias.
- Price has pulled back from the H4 swing high at 1.0898 and is sitting just above the H4 swing low at 1.0818.
- The area between the H4 HL (1.0818) and the Daily S/R zone (1.0820–1.0845) is your entry zone.
Entry zone: 1.0818–1.0845.
Step 3 — H1 chart: Confirm approach and momentum
On the H1 chart:
- Price is within the entry zone, currently at 1.0842.
- The approach to the zone was a slow three-candle decline — corrective retracement, not aggressive impulsive selling.
- H1 structure shows a small CHOCH to the upside: the most recent H1 swing low at 1.0826 has held, and the most recent H1 candle has produced a higher high.
The picture: price is in the zone, momentum is fading, H1 structure has begun to turn bullish.
Step 4 — M15 chart: Identify the entry trigger
You are waiting for a M15 BOS above the most recent M15 swing high at 1.0848, or a rejection candle at 1.0818 if price dips further.
Twenty minutes later: price dips to 1.0827, then a strong bullish M15 candle closes at 1.0852, taking out the swing high at 1.0848. BOS confirmed.
- Entry: 1.0852
- Stop: below the M15 swing low at 1.0822, with 5-pip buffer → 1.0817
- Stop distance: 35 pips
- Target: previous H4 HH at 1.0898 → 46 pips
- Risk:Reward: 1:1.3
You calculate position size from your risk % and the 35-pip stop. You enter.
Why this setup was high confluence:
- Daily bullish trend confirmed (HH/HL sequence intact)
- H4 structure aligned, pullback to H4 HL zone
- H1 momentum consistent with corrective retracement ending
- M15 BOS at the exact confluence zone
- Entry zone overlaps with Daily S/R zone and PWL cluster
What would have invalidated the setup:
- Daily chart breaking below the confirmed HL at 1.0755 — invalidates the bull structure
- H4 forming a new LL below 1.0755 — structural breakdown
- M15 BOS to the downside from within the zone — sellers still in control
The comparison: a low-confluence trade in the same scenario
A trader sees the M15 BOS at 1.0848 but skips Step 1 and Step 2. They enter without checking the Daily bias or whether price is at a logical H4 zone. This might be a valid BOS — but without the higher-timeframe context, it is one of dozens of M15 BOS events per day on any pair. The top-down process is how you filter the high-probability ones from the noise.
Common Mistakes
Starting at the M15 and working up only when the trade looks good. This is post-rationalisation, not analysis. The process goes top-down, every time.
Entering before the trigger forms because "price is near the zone." Being near the zone is not the trade — the confirmed trigger in the zone is the trade. Many of the worst losses come from entries taken too early, before the signal has confirmed.
Abandoning the process after a losing trade. A losing trade that followed the top-down process correctly is a good trade. The framework manages probabilities over many trades — one loss does not invalidate the process.
Applying different timeframe frameworks to different instruments inconsistently. If you trade EURUSD with a Daily → M15 framework, apply the same framework to XAUUSD and your index. Inconsistency in process produces inconsistent results.
Key Takeaways
- Top-down analysis means building context from the highest timeframe first, before looking for entry signals.
- The four steps: establish directional bias (Daily), locate entry zone (H4), confirm approach (H1), identify trigger (M15).
- Confluence = multiple independent pieces of evidence pointing at the same trade. Higher confluence = higher quality.
- Conflicting timeframes = reduce size, tighten criteria, or pass the trade.
- The daily preparation checklist takes 5–10 minutes and is one of the highest-return habits in trading.
Module 4 Chart Exercise
Complete the following top-down analysis on EURUSD or XAUUSD:
- Daily chart: state the trend direction and mark the two most important structural zones.
- H4 chart: state whether H4 structure is aligned with or counter to the daily trend. Mark the entry zone.
- H1 chart: state whether price is currently in/near the entry zone, and describe the momentum of the approach.
- M15 chart: state whether a valid trigger has formed. If yes, describe it. If no, state what you are waiting to see.
Write this down as if you were completing the daily preparation checklist above. Do not just look at the charts — write the answers.
Lesson Objective
By the end of this lesson, you should be able to complete a full top-down analysis on any instrument using the four-step Daily → H4 → H1 → M15 process, identify a valid entry zone from H4, and explain the difference between high-confluence and low-confluence setups.
Get notified when new lessons and content are published.