Course Outline — Lesson 2 of 22 ▼
L1.2 — Who Is Really in the Market?
Who Is Really in the Market?
The forex and gold markets are not level playing fields. When you place a trade, you are not competing against other retail traders in some neutral arena. You are operating in a market that includes central banks, commercial banks, hedge funds, institutional asset managers, algorithmic trading firms, and market makers — entities with vastly more capital, information, and infrastructure than any individual trader.
This is not presented to discourage you. It is presented because understanding the participant hierarchy explains why price moves the way it does. Many of the patterns that seem random on a chart make more sense when you understand who is likely responsible for them.
The Participant Hierarchy
Central Banks
Central banks — the Federal Reserve (US), European Central Bank, Bank of England, Bank of Japan — are the most powerful participants in forex markets. Their primary role is managing monetary policy (interest rates, money supply), not making profits from trading. But their decisions directly drive long-term currency trends. A decision to raise interest rates typically strengthens a currency by attracting capital seeking higher returns. A decision to cut rates typically weakens it.
Central bank actions and statements are the single most important fundamental driver of major forex pairs. Economic events such as Federal Reserve rate decisions and statements from central bank governors move markets by hundreds of pips within minutes.
Commercial Banks and Institutional Traders
Large commercial banks (JPMorgan, Citibank, Deutsche Bank, HSBC) handle enormous volumes of currency for corporate clients, international trade settlement, and proprietary trading. They operate with analytical resources, execution infrastructure, and order flow information that retail traders do not have access to.
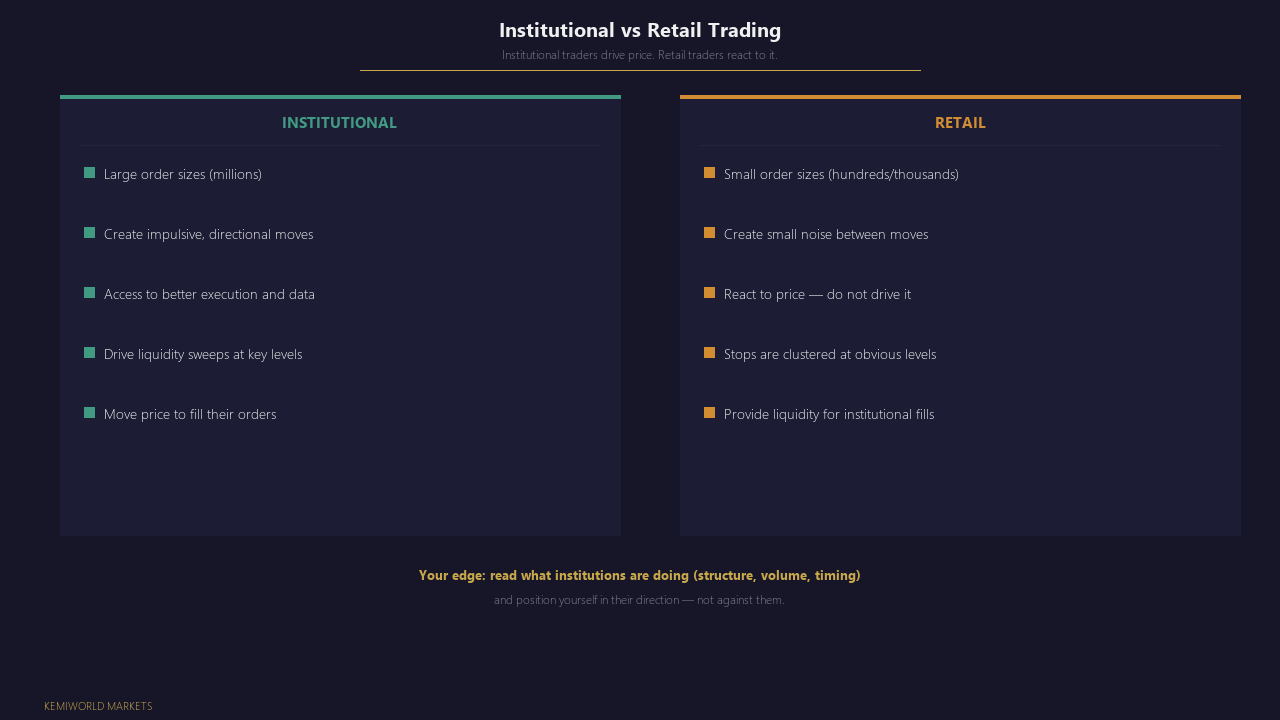
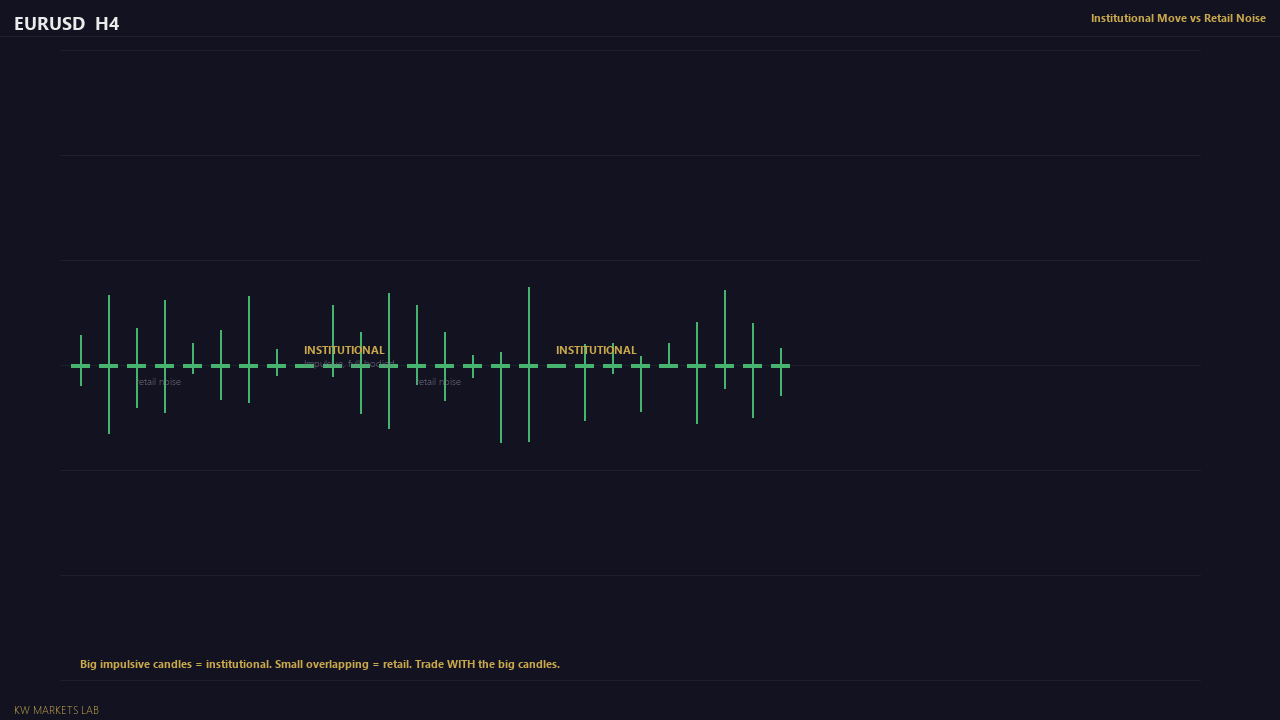
Hedge funds and institutional asset managers operate on longer timeframes with large position sizes. Their entries and exits leave visible marks on higher-timeframe charts — the large impulsive moves you see on daily and weekly charts are typically institutional in origin.
Market Makers
Market makers are institutions (often the same large banks) that quote both a buy price and a sell price for a currency pair simultaneously, profiting from the spread between the two. They provide the liquidity that allows retail traders to execute trades at any time without finding a specific counterparty.
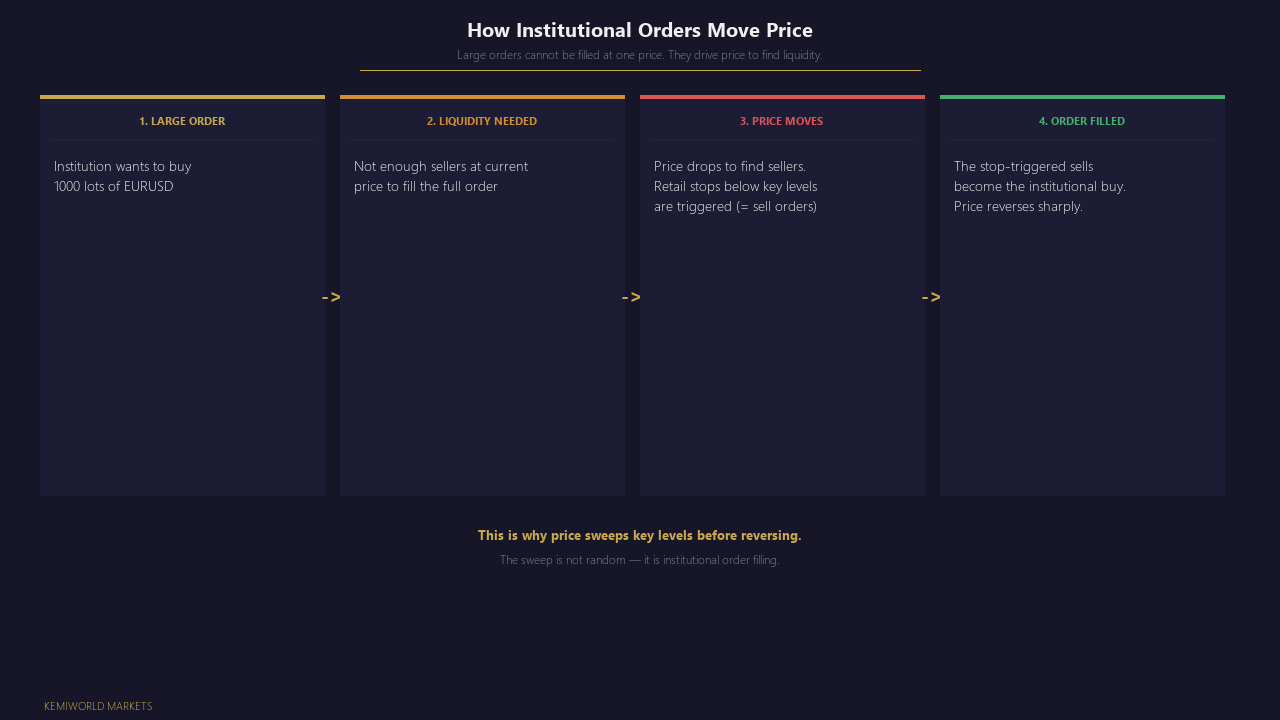
Market makers are not passive. They manage their own exposure and hedge against the positions they take on. This is relevant to retail traders because market makers are aware of where large clusters of stop losses sit (often just below obvious support levels or above obvious resistance levels), and price frequently moves through these clusters before reversing — a phenomenon sometimes called "stop hunting" or liquidity sweeping.
Algorithmic Trading Systems
A significant proportion of daily market volume in forex and indices is generated by algorithmic systems executing strategies automatically. These systems range from simple momentum-following scripts to sophisticated statistical arbitrage models. They respond to price levels, news events, and technical signals at speeds no human trader can match.
Algorithmic participation reinforces levels and patterns that are widely monitored, because many algorithms reference the same data. It also creates brief sharp moves around news events as algorithms process information and reposition simultaneously.
Retail Traders
Retail traders — individuals trading via a broker with a personal account — collectively represent a small fraction of total daily market volume. Individual retail trades have no measurable impact on price. This means retail traders are price-takers: they accept the price the market offers rather than influencing it.
The implication is important: retail analysis does not move price. But retail behaviour aggregates predictably. Large numbers of retail traders cluster their stop losses at obvious structural levels. They enter trades at the same visible patterns. Market participants with order flow visibility are aware of this clustering. Understanding this is not a reason for paranoia, but it is a reason to avoid placing stops in the most obvious positions.
What This Means for Your Analysis
There are two practical takeaways from understanding the participant hierarchy:
1. Trend direction is set by institutions, not retail traders.
The long-term trends on daily and weekly charts are driven by institutional positioning — large funds building positions over weeks or months. Retail traders do not create these trends. The most reliable approach is to identify the direction of institutional flow on higher timeframes and look for low-risk entries in that direction, rather than trading against it.
2. Price often moves through obvious retail levels before continuing.
Retail stop losses accumulate below obvious swing lows and above obvious swing highs. Price often sweeps through these levels, triggering the stops, before reversing in the intended direction. This is not manipulation in the legal sense — it is rational behaviour by participants who can see where liquidity sits. Learning to read this — rather than placing your stop at the exact level everyone else is using — is a structural advantage.
Lesson Summary
- Markets include central banks, commercial banks, hedge funds, market makers, algorithmic systems, and retail traders.
- Retail traders collectively represent a small share of volume and cannot influence price direction.
- Long-term trends are set by institutional positioning, not retail analysis.
- Price frequently moves through obvious retail stop levels before reversing — understanding this informs better stop placement.
Lesson Objective
By the end of this lesson, you should be able to name the main categories of market participant, explain the role each plays, and describe in plain language why retail traders should understand institutional behaviour even if they cannot observe it directly.
Get notified when new lessons and content are published.