Course Outline — Lesson 6 of 22 ▼
L2.3 — Break of Structure and Change of Character
Break of Structure and Change of Character
Identifying a trend tells you what is happening. Break of Structure (BOS) and Change of Character (CHOCH) tell you what is changing. These two concepts complete the structural reading toolkit and allow you to detect when a trend is continuing, weakening, or potentially shifting.
Understanding the distinction between a BOS and a CHOCH is one of the most practically useful skills in structural analysis. It directly affects how you build directional bias and when you adjust it.
Break of Structure (BOS)
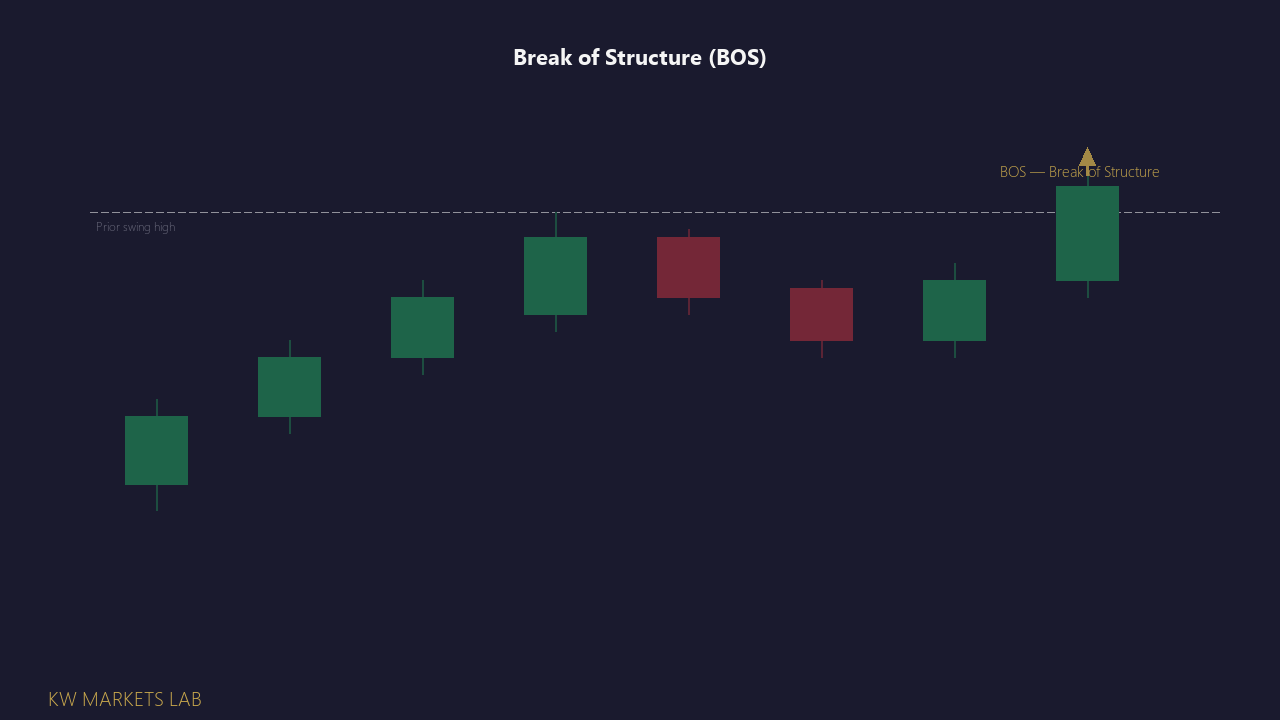
A Break of Structure occurs when price closes beyond the most recent significant swing point in the direction of the current trend.
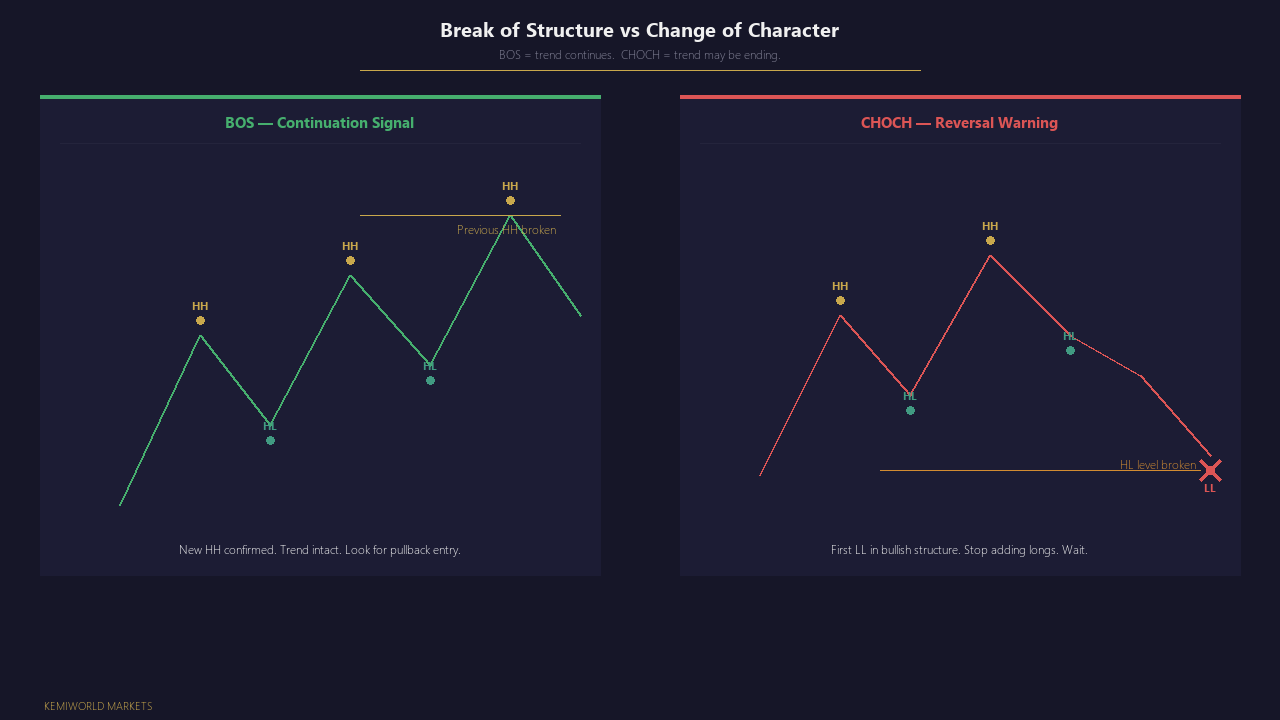
In an uptrend: a BOS occurs when price closes above the most recent swing high, forming a new higher high. This confirms that the uptrend is continuing — buyers are strong enough to break the previous peak and extend the trend.
In a downtrend: a BOS occurs when price closes below the most recent swing low, forming a new lower low. This confirms the downtrend is continuing — sellers are strong enough to break the previous trough and extend the trend.
A BOS is a continuation signal. It does not mean "buy immediately" or "sell immediately" — it means the existing trend structure is intact and progressing. Your directional bias is confirmed.
The key rule: a BOS requires a candle close beyond the swing level, not just a wick. A wick that briefly exceeds a previous high but closes back below it is not a BOS — it may actually be a liquidity sweep (covered in Module 3). A BOS is a committed close through the level.
Change of Character (CHOCH)
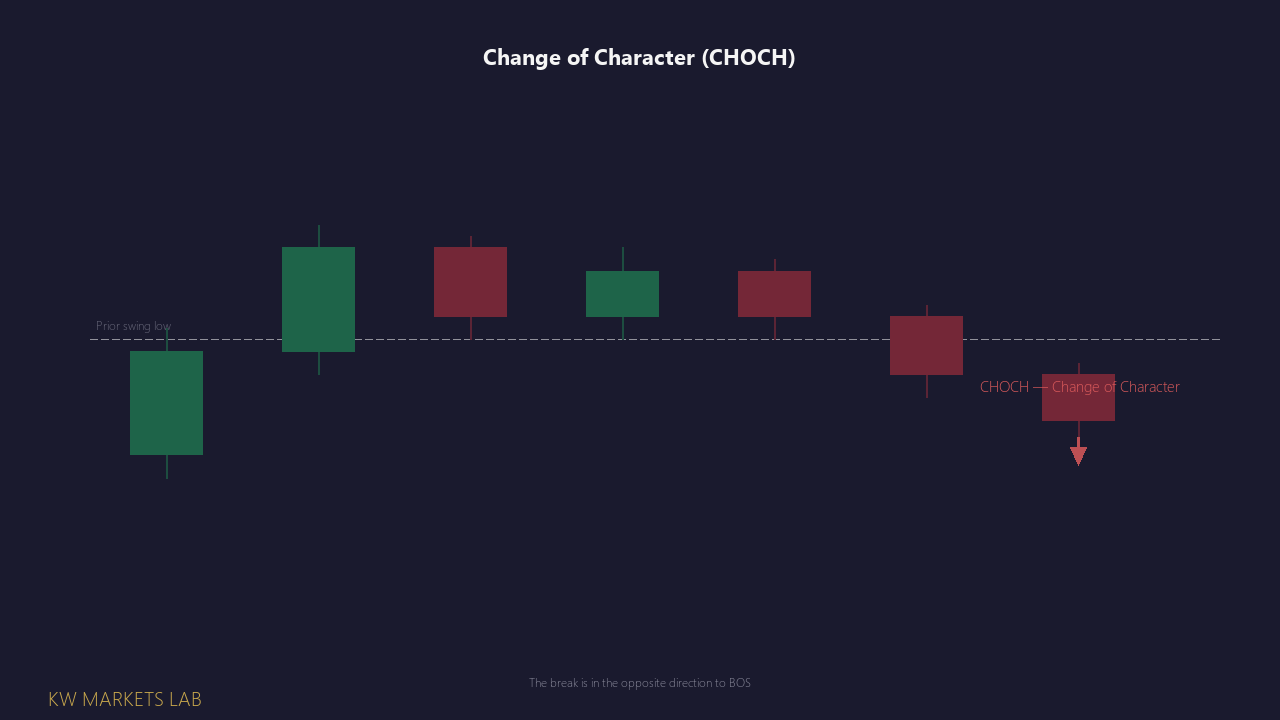
A Change of Character occurs when price closes beyond a swing point in the direction opposite to the current trend.
In an uptrend: a CHOCH occurs when price closes below the most recent swing low — breaking the most recent higher low. This is the first structural evidence that the uptrend may be losing control. Buyers have failed to hold the level that previously supported the trend.
In a downtrend: a CHOCH occurs when price closes above the most recent swing high — breaking the most recent lower high. This is the first structural evidence that the downtrend may be losing control. Sellers have failed to cap the price at the level that previously capped the trend.
A CHOCH is a caution signal. It does not confirm a reversal. It confirms that the existing trend structure has been disrupted and that the balance of pressure is shifting.
The Distinction: Why It Matters
The difference between a BOS and a CHOCH is the difference between confirmation and caution.
| Signal | What happened | What it means |
|---|---|---|
| BOS (in trend direction) | Price closes beyond a swing point in trend direction | Trend continuing — bias confirmed |
| CHOCH (against trend) | Price closes beyond a swing point against trend direction | Trend disrupted — bias under review |
After a CHOCH, two things can happen:
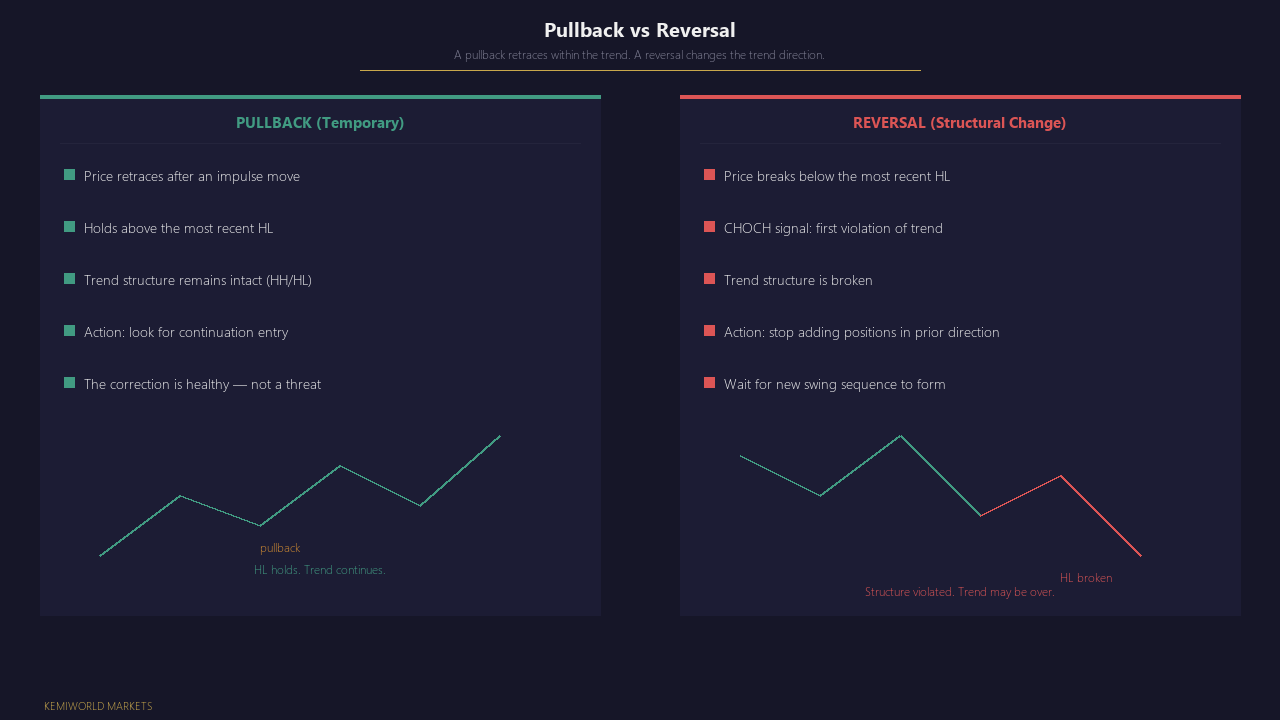
- The move was corrective. Price dipped through the prior HL (triggering the CHOCH) but quickly reclaimed it and resumed the uptrend. The uptrend continues; the CHOCH was a false signal. This is common on lower timeframes where noise is higher.
- The move was the start of a reversal. After the CHOCH, price fails to make a new HH, then forms a lower high, then breaks below the swing low again. The structure is now building a sequence of LH/LL — a new downtrend is forming.
The CHOCH is the first warning. The subsequent behaviour of price confirms whether it was meaningful.
How These Concepts Are Used for Directional Bias
BOS and CHOCH are tools for building a directional bias — a read on whether the market is currently bullish, bearish, or in a transitional state.
Use BOS to confirm trend continuation. When a trend has been established and each new impulsive move produces a BOS (a new HH in an uptrend), your bullish bias is confirmed. You look for pullbacks to the most recent HL as potential entry zones.
Use CHOCH as a reason to pause. When a CHOCH occurs, do not immediately reverse your bias. Wait. Let price establish what it is doing next. A CHOCH followed by a clear sequence of LH/LL forming on the chart is the earliest point at which a reversal bias can be considered — not the CHOCH itself.
BOS and CHOCH are not entry triggers. They tell you about the state of trend. Your entry trigger is separate — a specific price action confirmation at a defined level. This course covers that in Module 4 (top-down analysis) and more specifically in the strategy library. For now, understand that structure tells you the context; the trigger tells you the moment.
A Common Error: Treating Every CHOCH as a Reversal
Beginners frequently see a CHOCH and immediately look for reversal trades. This produces a high rate of failed entries because:
- Many CHOCHs on lower timeframes are temporary pullbacks in a higher-timeframe trend.
- A CHOCH at the 15-minute level often means nothing at the 4-hour level.
- Reversals require structural confirmation that takes time to develop.
The discipline here is patience: observe the CHOCH, note it, and wait for the subsequent structure to confirm whether a reversal is building. Do not front-run it.
Lesson Summary
- BOS: Price closes beyond a swing point in the trend direction — trend continues, bias confirmed.
- CHOCH: Price closes beyond a swing point against the trend direction — trend disrupted, bias under review.
- A BOS requires a candle close, not just a wick.
- CHOCH is a caution signal, not a reversal confirmation.
- Neither BOS nor CHOCH is an entry trigger — they define the context for entries.
Module 2 Chart Exercise
Using any chart on the H4 or Daily timeframe:
- Mark the five most recent swing highs and swing lows.
- Identify whether the current structure is an uptrend (HH/HL), downtrend (LH/LL), or range.
- Identify the most recent BOS — the last swing point that was broken in the direction of the current trend.
- Identify whether a CHOCH has occurred recently and what price did after it.
Do this on at least three different charts (e.g., EURUSD Daily, XAUUSD H4, S&P500 H4) before moving to Module 3.
Lesson Objective
By the end of this lesson, you should be able to identify a Break of Structure and a Change of Character on any chart, explain what each signals in the context of the current trend, and describe why CHOCH is a caution signal rather than a reversal confirmation.
Try This
Open the H4 chart on any instrument you have been watching.
- Identify the most recent trend sequence — at least two HH/HL pairs for an uptrend, or two LH/LL pairs for a downtrend
- Find the last structural pivot — the most recent higher low (uptrend) or lower high (downtrend)
- Mark that level on your chart
Now ask: has price since closed beyond that level?
If yes: you are looking at a structural break. Ask yourself — does this break continue in the trend direction (BOS) or does it move against it (CHOCH)?
If no: that level is still the active structural reference. The thesis holds until it does not.
Do not trade from this observation. Practise reading the current structural state of the market — what is it doing right now, based only on what price has printed?
Get notified when new lessons and content are published.