Course Outline — Lesson 7 of 22 ▼
L3.1 — Support and Resistance Zones (Not Lines)
Support and Resistance Zones (Not Lines)
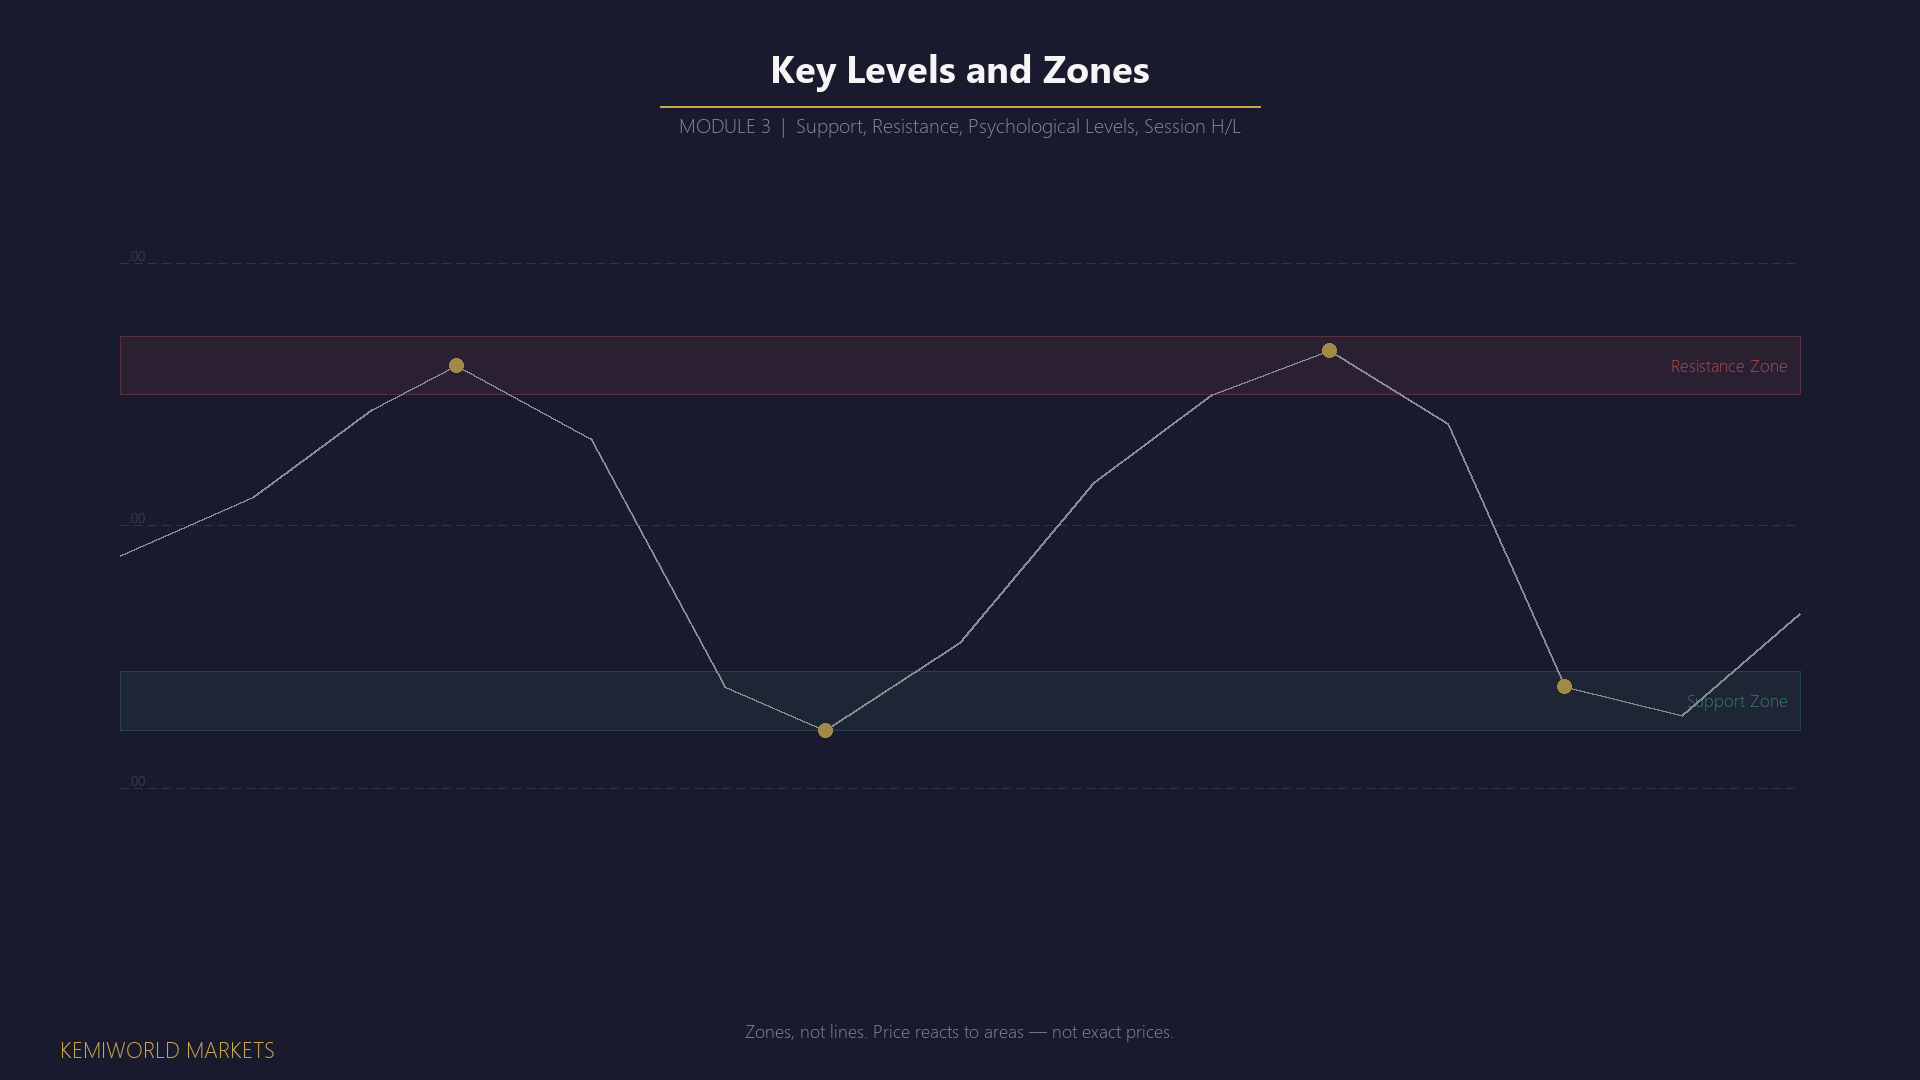
Support and resistance are among the most misunderstood concepts in retail trading — not because the idea is complex, but because the most common way of applying them is wrong. The phrase "support and resistance zones" is deliberate. They are not precise price lines. They are areas.
This lesson explains what support and resistance actually represent, how to identify significant zones correctly, how role reversal works, and the single most common mistake traders make when drawing levels.
What Support and Resistance Actually Represent
Price moves because of the balance between buying pressure and selling pressure. At any given level, there is a history of how that balance played out.
Support is a price area where buying pressure has previously been strong enough to stop a downward move and push price back up. Buyers stepped in at that level, demand exceeded supply, and price reversed upward.
Resistance is a price area where selling pressure has previously been strong enough to stop an upward move and push price back down. Sellers stepped in at that level, supply exceeded demand, and price reversed downward.
The reason these levels matter in the future is that they represent areas where large orders have historically been executed. Those orders may still be waiting — unfilled positions, breakeven levels, institutional entry zones. Price tends to react at these areas again because the same participants (or their algorithms) are still active in the same zones.
This is not a mystical concept. It is practical order flow behaviour.
Why Zones, Not Lines
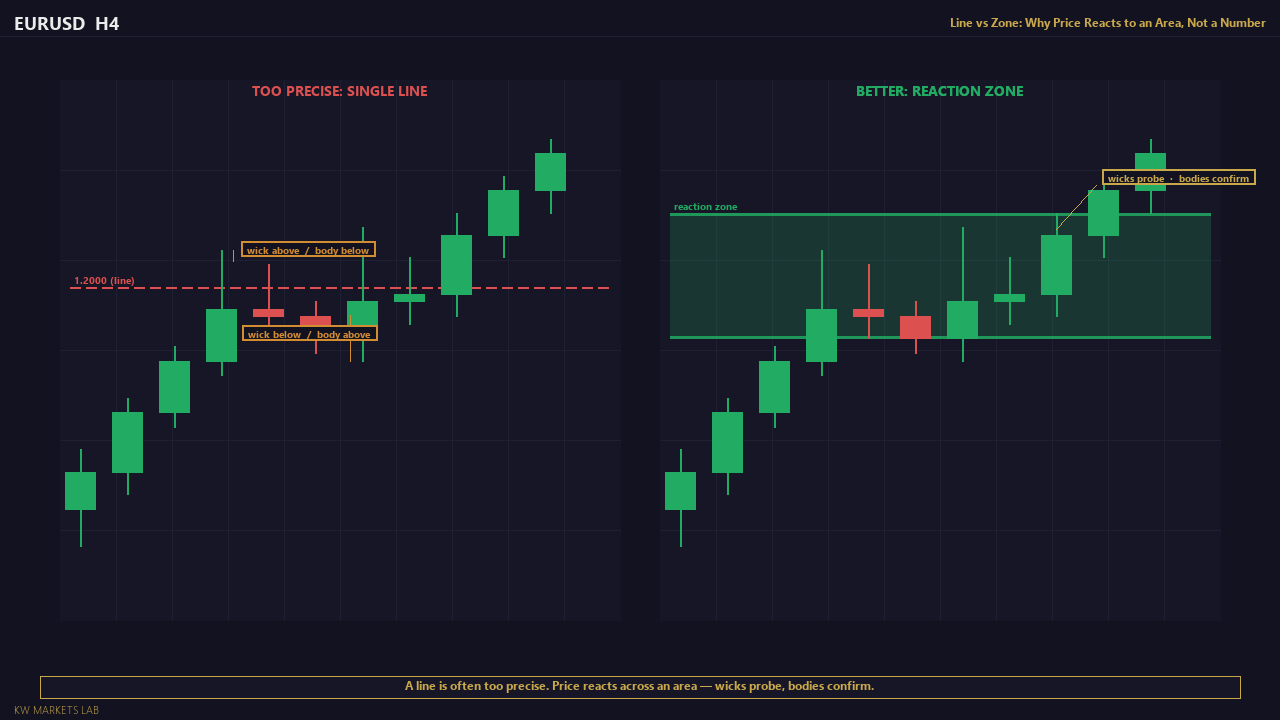
A common beginner approach is to draw a horizontal line at the exact high or low of a swing point. This is precise but incorrect. Price rarely reacts at a single number. It reacts in an area.
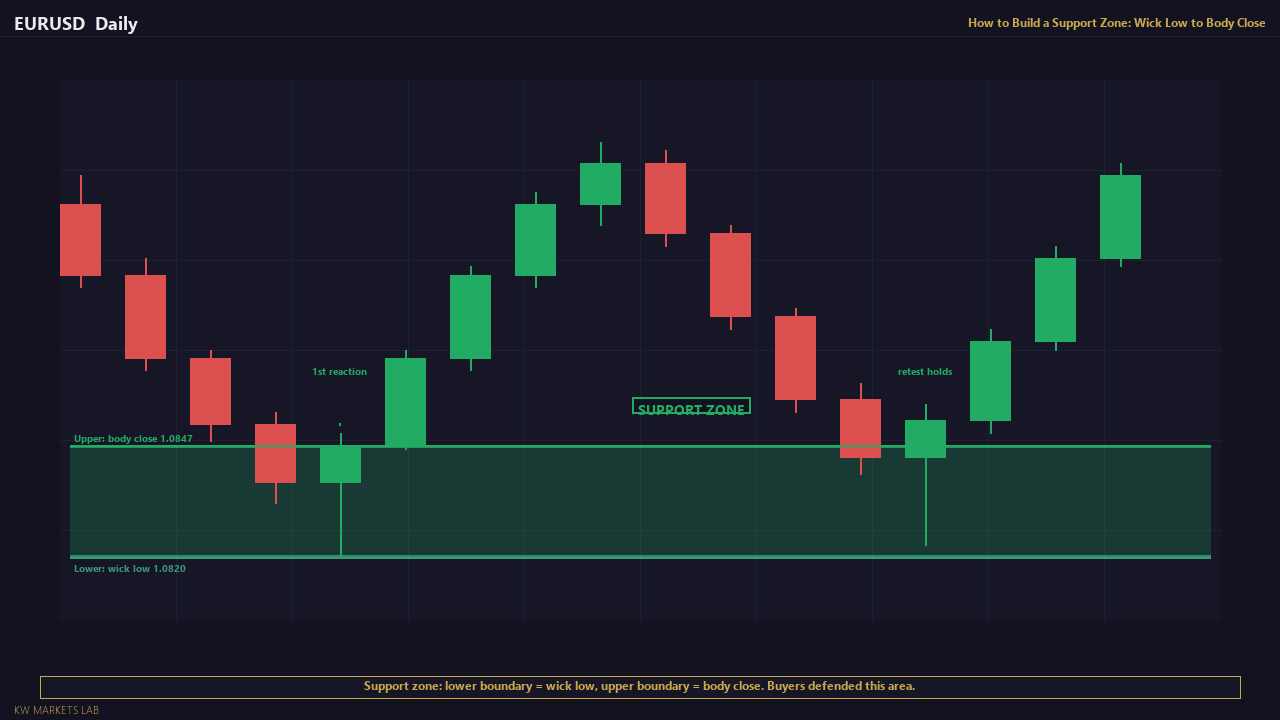
Consider a swing low that formed on the daily chart at 1.0820 on EURUSD. The candle's low was 1.0820. But the body of that candle closed at 1.0847. The next time price approaches this area, it might react at 1.0832 — inside the zone, not at the exact wick tip. If you drew a line at 1.0820, you would consider the zone "broken" and miss the real reaction.
A support zone is defined by the range between the body close of the reaction candle and the wick extreme. This gives the zone width. For a swing low:
- Lower boundary: the low of the wick (the absolute extreme)
- Upper boundary: the close of the candle body (where buyers regained control)
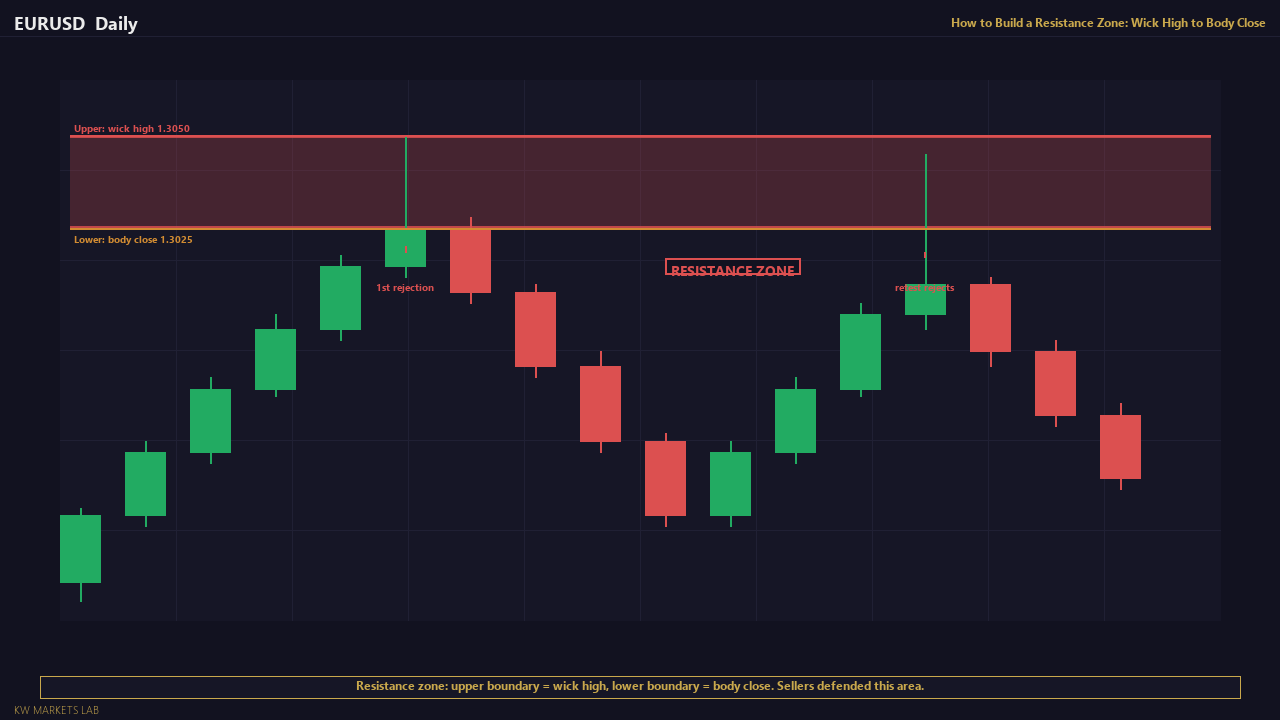
For a swing high:
- Upper boundary: the high of the wick
- Lower boundary: the close of the body
In practice, for daily timeframe levels, zones are often 10–40 pips wide on forex pairs. On XAUUSD, they can be $5–$20 wide depending on the reaction size.
How to Identify Significant Support and Resistance Zones
Not every prior swing point is worth marking. The criteria for significance:
Strong initial reaction. A zone that caused a sharp, decisive reversal (a large impulsive candle or multiple strong candles in one direction) is more significant than one that caused a slow drift.
Multiple touches. A zone that has been tested and respected two or three times is stronger than one that has only been touched once. Each test that holds confirms the zone is still relevant.
Higher timeframe origin. A zone that formed on the daily or weekly chart is more significant than one that formed only on the 15-minute chart. Higher-timeframe zones attract more participation.
Clean, not cluttered. If a price area has had many touches without a decisive break, the zone may become "weak" — too many participants have used it and the orders sitting there are being gradually depleted. Very well-tested zones sometimes break easily when they are finally tested in earnest.
Practical rule: on any chart, identify no more than three to five key zones. If you are drawing more than that, you are marking noise.
Role Reversal: How Resistance Becomes Support (and Vice Versa)
One of the most reliable patterns in technical analysis is role reversal.
When price breaks through a resistance zone convincingly — a strong candle close above the zone — that former resistance often becomes support on a subsequent pullback. The logic: participants who previously sold at that level (expecting resistance to hold) now have losing positions. When price pulls back to that level, they may buy to exit at breakeven, adding buying pressure at the exact zone where selling pressure used to dominate. This is what turns resistance into support.
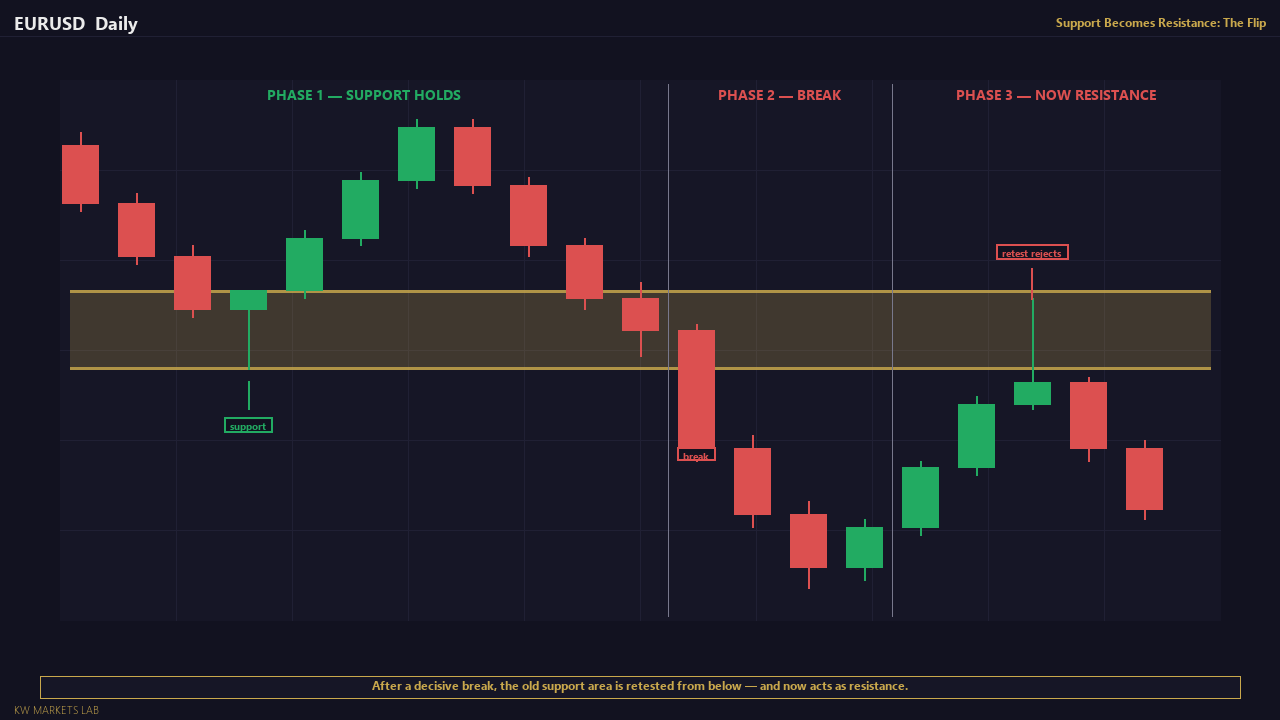
The same applies in reverse: a broken support level often becomes resistance on a subsequent bounce.
Role reversal is one of the highest-probability setups in technical trading, precisely because the order flow logic behind it is coherent. When you see price break a major resistance zone and pull back to re-test it from above, that re-test offers a low-risk entry in the direction of the break — provided the structure and directional bias support it.
The Most Common Mistake: Drawing Too Many Levels
The most widespread error beginners make with support and resistance is drawing a level at every single candle turn on their chart. This produces a screen full of lines that:
- Create false confidence — "there's a level right there, surely price will react"
- Contradict each other — with levels every 20 pips, price is always "at a level"
- Lead to overtrading — every touch of any line triggers an entry attempt
The discipline is selectivity. A chart with three clearly defined, high-quality zones tells a cleaner, more actionable story than a chart covered in twenty lines of varying significance.
Ask of each zone: would a professional, capital-moving participant care about this level? If the answer is no — if it formed on a minor timeframe in a low-liquidity move — remove it.
Common Mistakes Summary
- Drawing lines instead of zones (misses the real reaction area)
- Marking every turn on the chart (creates noise, not signal)
- Ignoring the timeframe the zone formed on (a 5-minute level has minimal weight against a weekly one)
- Treating old, heavily tested zones as equally strong as fresh ones (each test weakens the remaining orders)
- Not updating levels when price breaks through decisively (broken zones must be reclassified)
Key Takeaways
- Support is a zone where buying pressure stopped a decline. Resistance is a zone where selling pressure stopped a rally.
- Zones are defined by a range (wick extreme to body close), not a single price.
- Significance is determined by: reaction strength, number of touches, and timeframe of origin.
- Role reversal — broken resistance becomes support, broken support becomes resistance — is one of the most reliable structural patterns.
- Fewer, higher-quality zones make better trading decisions than many weak ones.
Checkpoint Exercise
Open a Daily chart of EURUSD or XAUUSD. Identify:
1. Two to three support zones that have caused at least two clean bounces.
2. Two to three resistance zones that have caused at least two clean rejections.
3. One example of a role reversal — a former resistance that became support, or vice versa.
For each zone, note: which timeframe it formed on, how many times it has been tested, and whether the zone is fresh (first or second test) or well-tested (three-plus touches).
Lesson Objective
By the end of this lesson, you should be able to identify two to three key support and resistance zones on a Daily or H4 chart, draw them correctly as zones (not lines), and identify at least one example of role reversal.
Try This
Open the Daily chart on any instrument.
- Identify the most recent area where price spent time before a significant directional move — this is likely a zone, not a single candle
- Draw a rectangle covering that area. Use the range between the candle bodies as the core zone, extending slightly to include the most significant wicks
- Check: has price returned to this area since?
If it respected the zone: you have identified an active level. Drop to H4 and observe how price approached and reacted.
If it traded through: what happened immediately after? Did price consolidate just beyond the zone before continuing? That pattern — pause after breach — often signals role reversal. Former support can become resistance.
The exercise is not to find a trade. It is to practise identifying zones that have already demonstrated relevance — not zones you are hoping will hold.
Get notified when new lessons and content are published.