Course Outline — Lesson 13 of 22 ▼
L5.1 — XAUUSD Fundamentals: What Drives Gold Price
XAUUSD Fundamentals: What Drives Gold Price
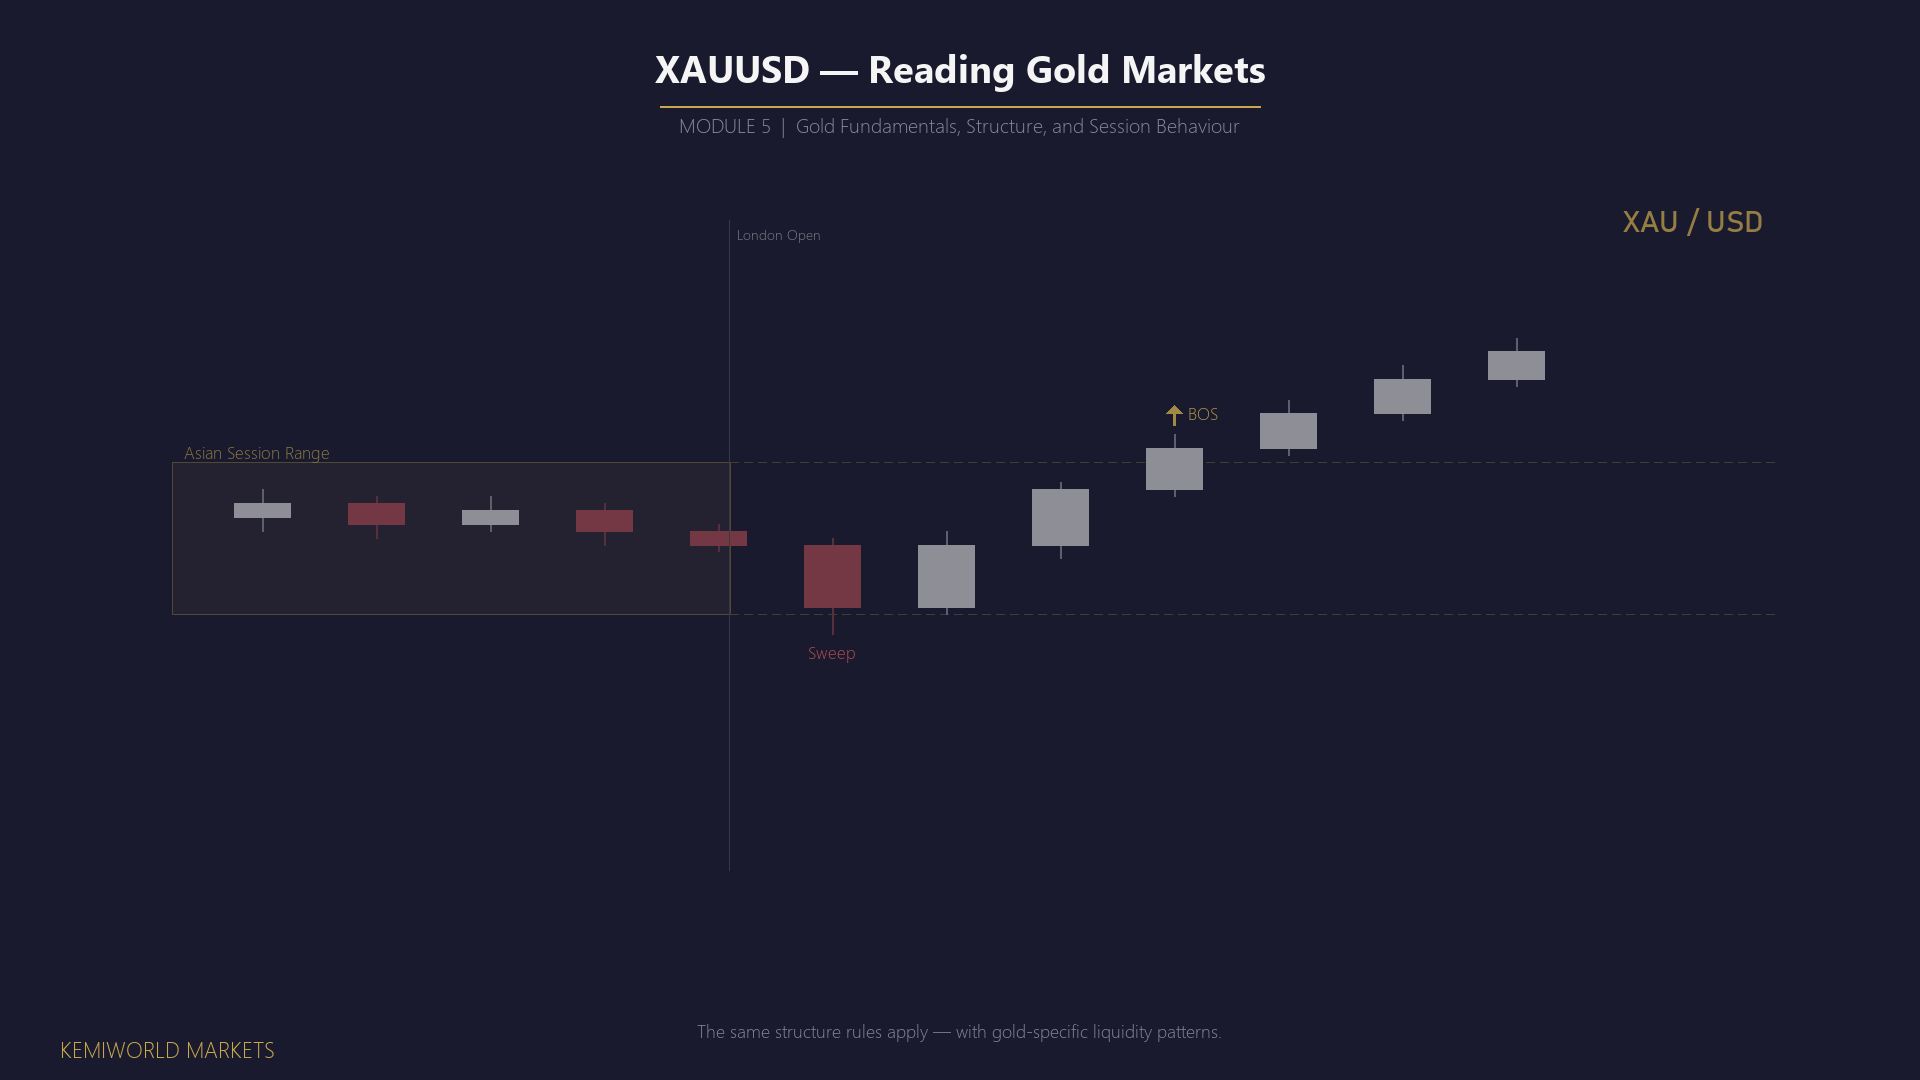
Gold is not just another trading instrument. It sits at the intersection of commodity markets, currency markets, and macro-economic sentiment in a way that no forex pair does. To trade XAUUSD effectively, you need to understand what drives its price — not at a textbook level, but at the practical level of knowing which factors to check before placing a trade and which data releases are most likely to cause sharp moves.
This lesson covers the primary fundamental drivers of gold price, the USD inverse relationship and its limitations, safe-haven behaviour, real yields, and how to run a fast pre-trade fundamental check.
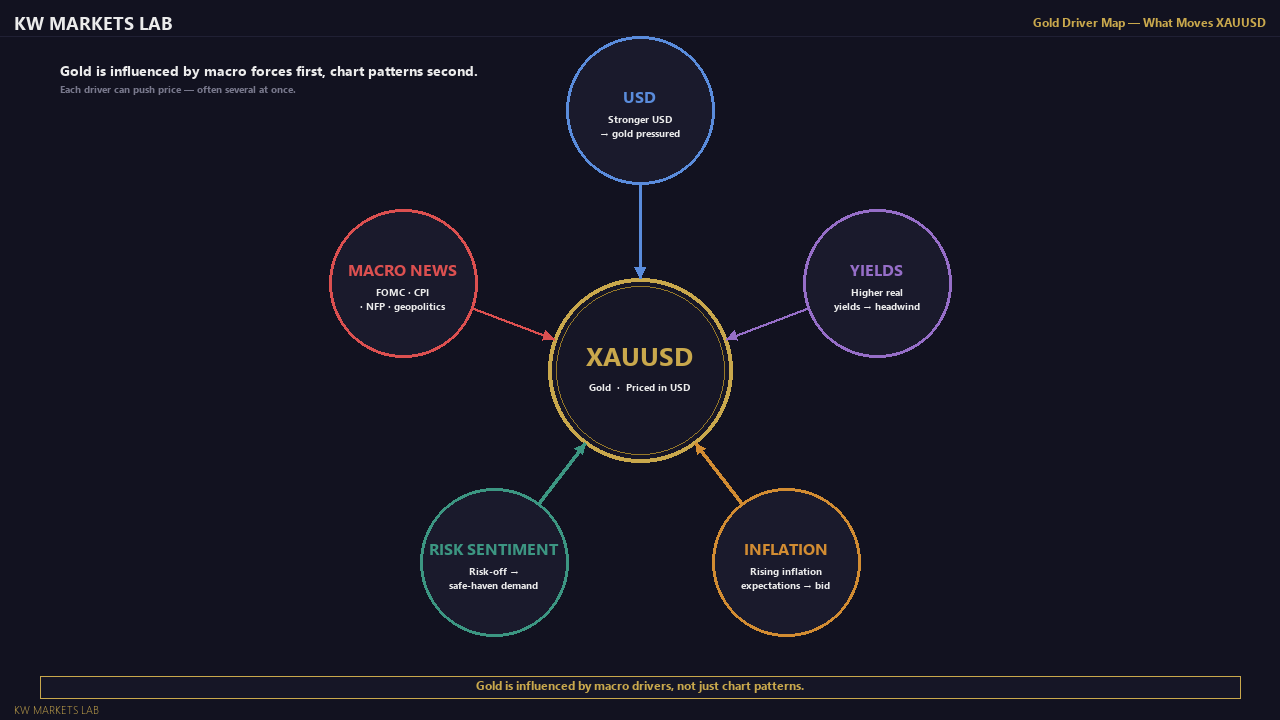
Gold as a Dollar-Denominated Asset
XAUUSD is the price of one troy ounce of gold expressed in US dollars. This means gold has a structural relationship with the US dollar: when the dollar strengthens against other currencies, it takes fewer dollars to buy gold, so the gold price denominated in USD tends to fall. When the dollar weakens, gold tends to rise.
This inverse relationship between gold and the USD (specifically the DXY — the US Dollar Index) is real but not mechanical. It is a tendency, not a rule. There are many periods where gold and the dollar move in the same direction, particularly during periods of extreme risk-off sentiment where investors buy both dollars and gold simultaneously as safe-haven assets.
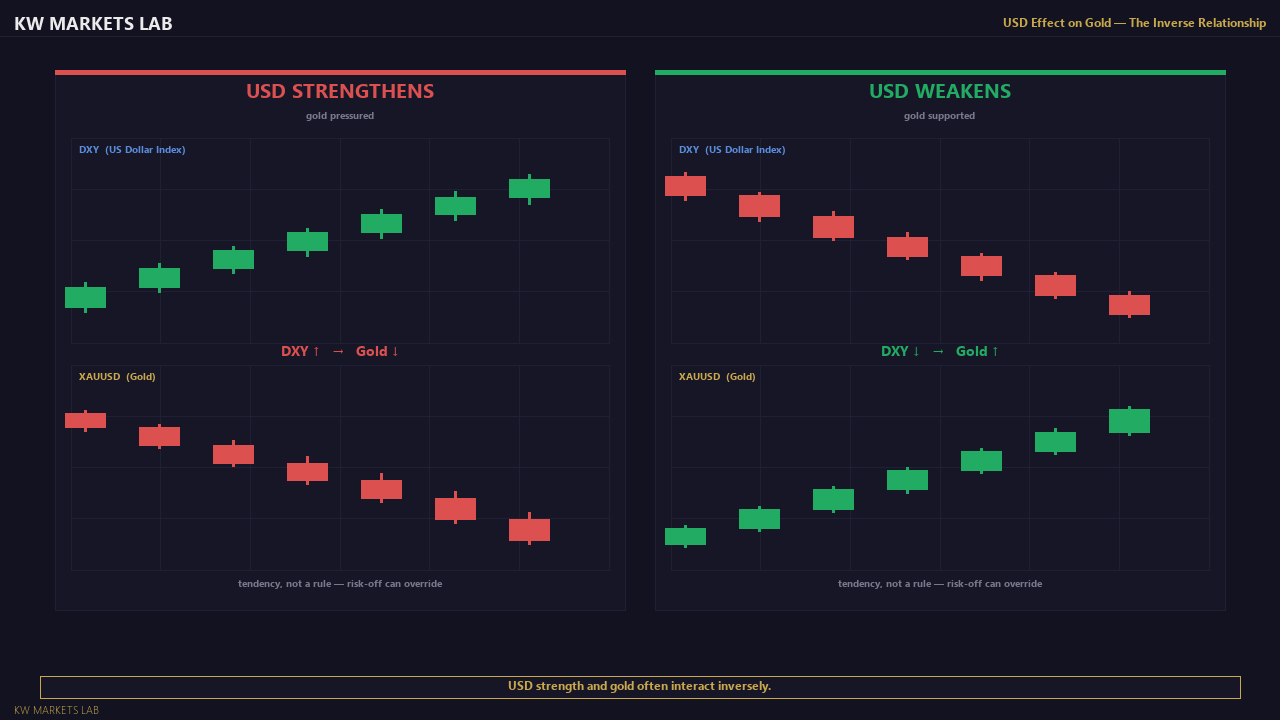
Practical check: Before entering a gold trade, look at the DXY chart on the same timeframe. If the DXY is in a clear uptrend and you are looking to buy gold, note the headwind. If the DXY is falling and gold is rising, the two are aligned — a cleaner setup.
Do not override structural analysis on the gold chart with DXY correlation alone. Treat DXY as a contextual filter, not a signal generator.
The Real Yield Relationship
One of the most important — and most overlooked — fundamental drivers of gold price is US real yields.
Real yield = nominal bond yield − inflation expectation (breakeven rate)
Gold pays no interest. It produces no yield. Therefore, when investors can earn a meaningful real return from holding US Treasury bonds, the opportunity cost of holding gold is high — and gold demand (and price) tends to fall. When real yields are negative (bonds lose value in real terms after inflation), gold's lack of yield becomes a relative advantage — and gold demand tends to rise.
The 10-Year US Treasury real yield (tracked via the TIPS market or through financial data platforms) is the single most reliable macro indicator for gold's medium-term direction:
- Real yields falling → gold bullish tailwind
- Real yields rising → gold bearish headwind
This relationship does not produce precise entry or exit signals, but it explains many of gold's extended bull and bear runs. Gold's strong bull market in 2020–2024 was heavily correlated with a period of negative real yields. When the Fed aggressively raised rates in 2022–2023, gold faced sustained pressure despite geopolitical uncertainty.
You do not need to track this in real time for every trade, but understanding it helps you assess whether the broader macro environment is favourable for gold longs or favourable for shorts.
Key Economic Events That Move Gold
These are the primary scheduled events that cause significant gold price moves. When any of these are due within the next 12–24 hours, treat the period as elevated-risk.
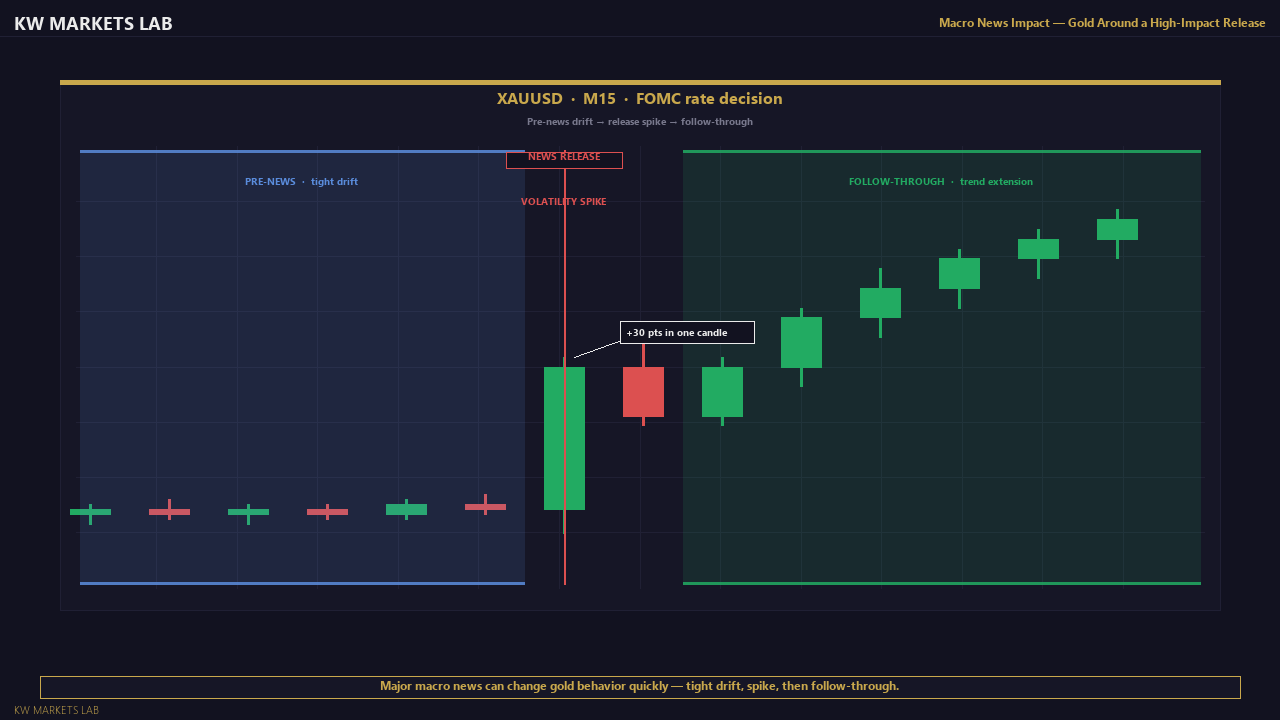
FOMC (Federal Open Market Committee) decisions and statements
Released approximately 8 times per year. The Federal Reserve's interest rate decisions and forward guidance are the single most market-moving events for gold. A dovish Fed (signalling rate cuts or slower tightening) is gold-positive. A hawkish Fed (signalling rate hikes or tighter policy for longer) is gold-negative.
The Fed Chair's press conference following the decision often creates more volatility than the decision itself, because the statement contains nuance about future policy direction.
CPI (Consumer Price Index — US inflation data)
Released monthly. Higher-than-expected inflation creates a complex reaction: it can be gold-positive (inflation erodes purchasing power, gold is an inflation hedge) in the short term, but gold-negative in the medium term if it leads to expectations of higher Fed rates (which raise real yields). In practice, the short-term reaction is often large and fast, and can go in either direction depending on market expectations heading into the release.
NFP (Non-Farm Payrolls — US employment data)
Released on the first Friday of every month at 13:30 London time. Strong employment data typically strengthens the USD and pressures gold. Weak data weakens the USD and supports gold. As with CPI, the deviation from expectations matters more than the absolute number.
Geopolitical events
Wars, sanctions, banking crises, and major political instability cause demand for gold to spike rapidly — the safe-haven function. These events are not scheduled and cannot be anticipated by technical analysis. They produce the most violent and fastest gold moves, often gapping over key structural levels.
Gold as a Safe-Haven Asset
When equity markets fall sharply, when banking stress increases, or when geopolitical risk escalates, investors and institutions move capital into assets perceived as safe stores of value. Gold is the most globally recognised of these.
The practical implication: in a risk-off environment (equities selling off, credit spreads widening, VIX spiking), gold typically benefits. This is why gold often rises during equity market crashes — the 2008 financial crisis, the 2020 COVID crash, and the 2022–2023 banking stress all produced significant gold rallies even when other commodities were falling.
This safe-haven demand is not infinitely reliable. In extreme liquidity crises (like the initial COVID crash in March 2020), gold can sell off alongside everything else as investors raise cash by selling whatever is liquid. These are temporary dislocations — gold typically recovers quickly in such scenarios.
For practical trading: when risk sentiment in equities is deteriorating rapidly, be cautious about shorting gold. When risk appetite is strong and equities are rallying broadly, gold longs face a stronger headwind.
What to Check Before Trading Gold
A simple pre-trade fundamental checklist for XAUUSD:
- Any major data releases in the next 12–24 hours? Check an economic calendar (Forex Factory, TradingEconomics). If FOMC, CPI, or NFP is due soon, treat volatility as elevated. Reduce size or wait for the release to pass.
- DXY trend direction? Open the DXY chart on the same timeframe as your gold analysis. Is it trending with or against your gold bias?
- Broad risk sentiment? Is the equity market (S&P 500) trending up (risk-on) or selling off sharply (risk-off)? Risk-off environments tend to support gold.
- Any major geopolitical news overnight? Check a financial news source briefly. Not for trading signals — for awareness of potential gap risk.
This check takes 2–3 minutes. It does not replace structural analysis. It flags conditions where the fundamental environment is significantly aligned with or opposed to your technical setup.
Common Mistakes
Treating the USD inverse relationship as a fixed rule. During risk-off events, gold and the USD can rise simultaneously. During a strong risk-on rally, both can fall. The relationship is a tendency with regular exceptions.
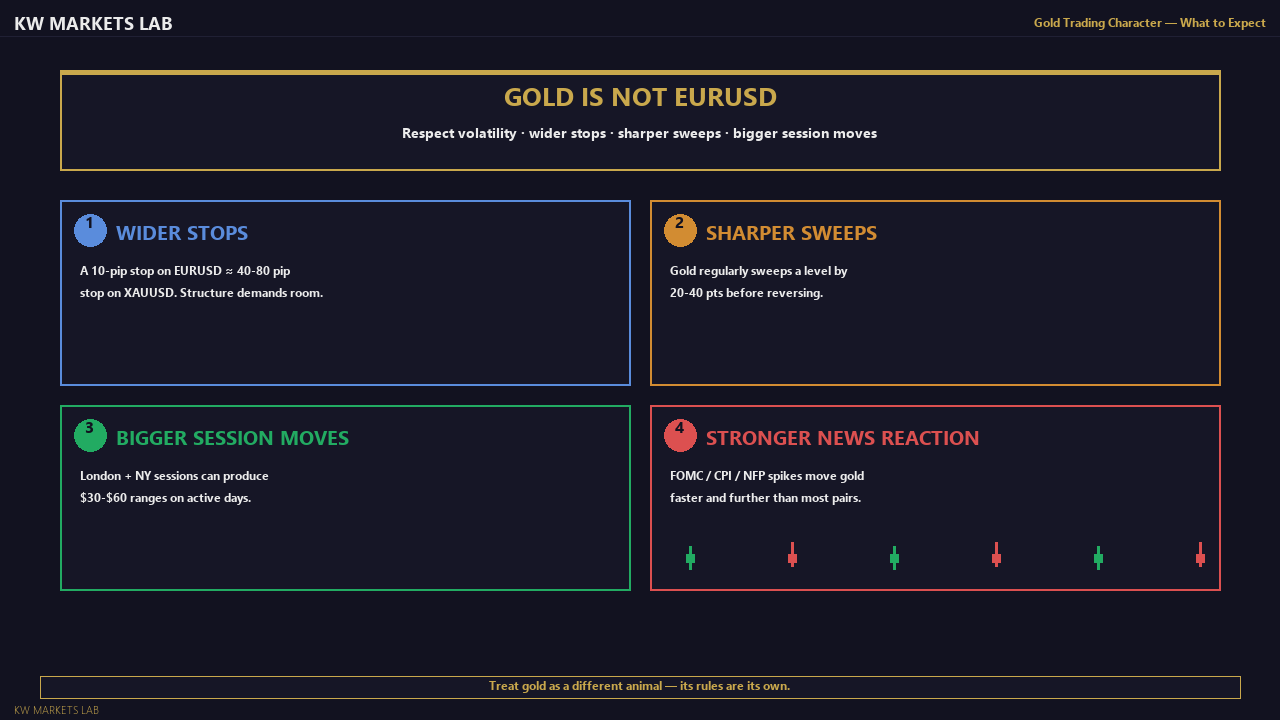
Trading through major data releases without adjusting for risk. FOMC statements, CPI prints, and NFP reports routinely produce 30–80 pip moves in gold in seconds. A trade that was technically valid before the release can be stopped out instantly by the spike, even if the direction was ultimately correct.
Ignoring fundamental context entirely. "I only use price action" is a common retail mantra. The problem: gold's price action is partly the output of fundamental market forces. Structural zones do not hold in the same way when a major fundamental force is running in the opposite direction.
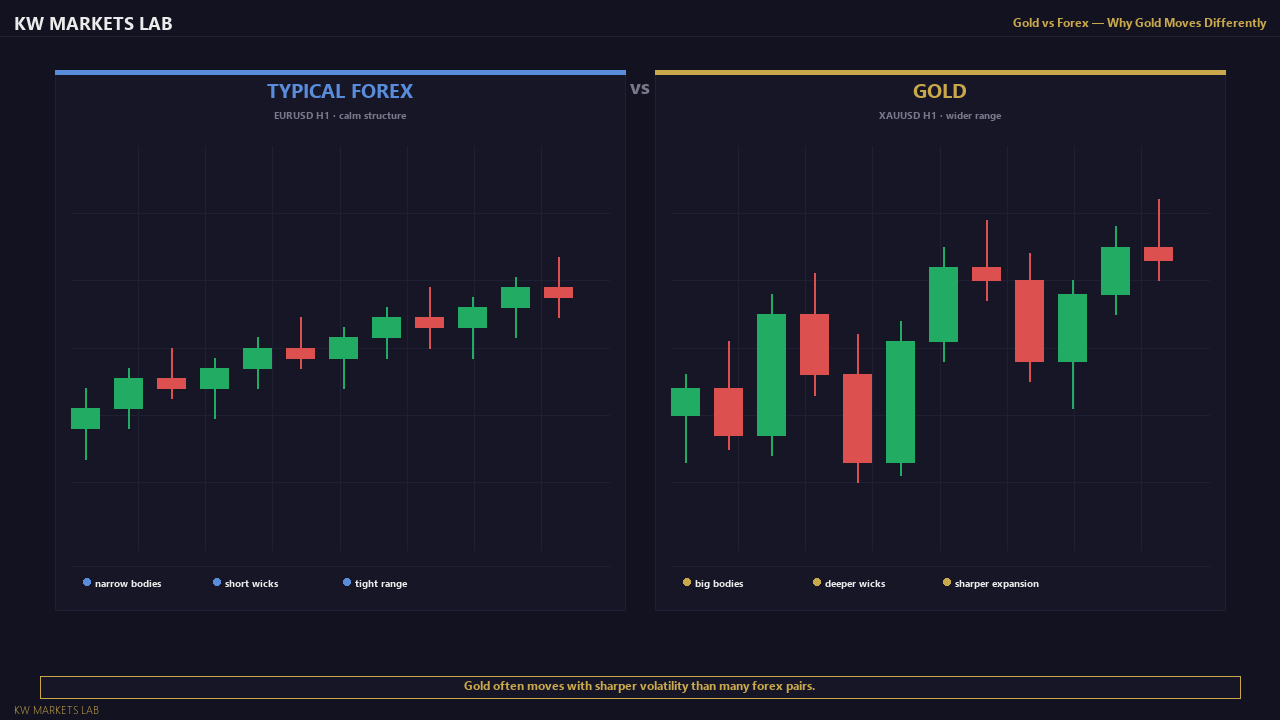
Using gold as a "safe" trade. Gold is one of the most volatile instruments available to retail traders. Its pip value is large, its intraday range can be $30–$60 on active days, and news spikes can be $50+ in a matter of minutes. It requires tighter risk management, not looser.
Key Takeaways
- XAUUSD is priced in USD — a weakening dollar is generally gold-positive; a strengthening dollar is generally gold-negative. But the relationship has meaningful exceptions.
- US real yields are the most reliable medium-term macro driver. Falling real yields = bullish for gold. Rising real yields = bearish for gold.
- FOMC, CPI, and NFP are the three highest-impact scheduled events. Check the economic calendar before every gold trade.
- Gold functions as a safe-haven during risk-off periods — equity market stress tends to support gold price.
- Run a 3-minute fundamental check (DXY, calendar, risk sentiment) before entering any gold trade.
Checkpoint Exercise
Before your next XAUUSD trade setup, complete the following checklist in writing:
- Is there a major data release within the next 12 hours? (Yes/No — specify which)
- What is the DXY doing on the Daily chart? (Uptrend / Downtrend / Ranging)
- Is the S&P 500 trending up or showing signs of risk-off selling?
- Does the fundamental environment broadly support or oppose your technical bias?
Do not enter the trade until you have answered all four.
Lesson Objective
By the end of this lesson, you should be able to name the primary fundamental drivers of gold price, explain the USD inverse relationship and its limitations, identify the three highest-impact scheduled events for XAUUSD, and describe what real yields are and why they matter for gold's medium-term direction.
Get notified when new lessons and content are published.