Course Outline — Lesson 3 of 22 ▼
L1.3 — How to Read a Candlestick Chart
How to Read a Candlestick Chart
A candlestick chart is the standard format for displaying price information in professional trading. Before you can do any analysis — structural, fundamental, or technical — you need to be able to read one accurately and understand what it is actually showing you.
This lesson covers the mechanics of candlestick charts and the concept of timeframes. It also addresses one of the most common errors beginners make: treating price as instruction rather than as information.
OHLC: The Four Values Behind Every Candle
Every candlestick represents a specific period of time — one minute, one hour, one day, or any other interval — and stores exactly four values:
Open (O): The price at the exact moment the period began.
High (H): The highest price reached during the period.
Low (L): The lowest price reached during the period.
Close (C): The price at the exact moment the period ended.
These four values — Open, High, Low, Close — are commonly abbreviated as OHLC and are the foundation of all candlestick analysis.
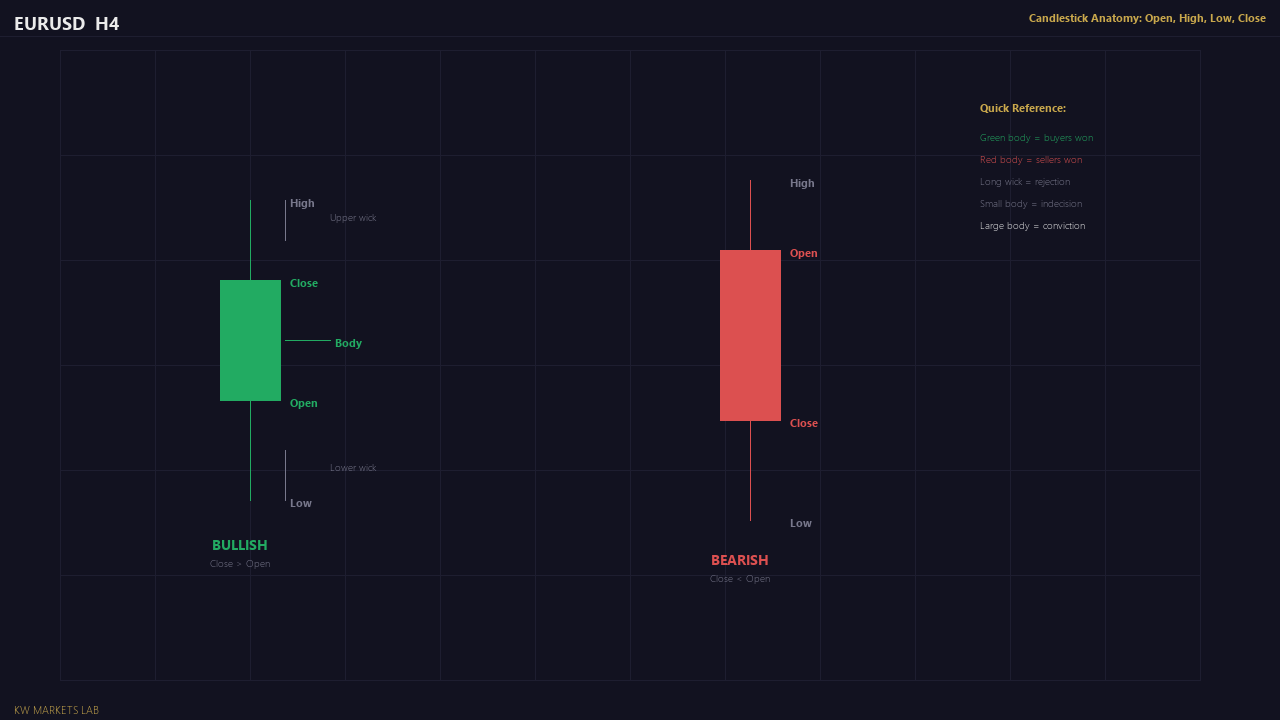
Anatomy of a Candlestick
A single candlestick has two visual components: the body and the wicks (also called shadows).
The body is the rectangular section of the candle. It represents the distance between the open and the close.
- If the close is higher than the open, the body is typically displayed as green or white: buyers controlled the period and price closed above where it opened.
- If the close is lower than the open, the body is typically displayed as red or black: sellers controlled the period and price closed below where it opened.
The wicks are the thin lines extending above and below the body. The upper wick extends from the top of the body to the period's high. The lower wick extends from the bottom of the body to the period's low.
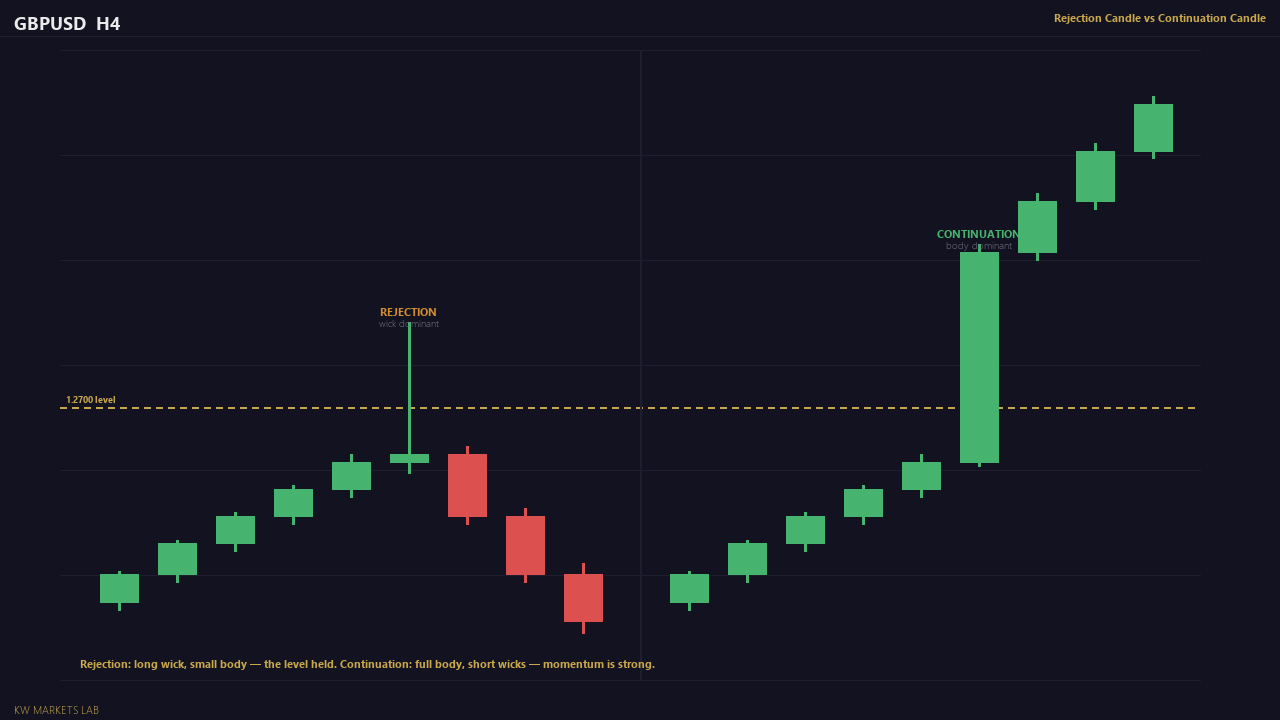
Wicks represent price reaching a level that was rejected before the close. A long upper wick means price pushed significantly higher during the period but was rejected and closed much lower than the high. A long lower wick means price pushed significantly lower but was rejected and closed much higher than the low.
Reading the wicks is essential. A candle with a small body and a long lower wick is not simply a "small red candle" — it tells you that sellers pushed price down aggressively but were rejected and pushed back up before the close. That is meaningful information about market pressure that the body alone does not convey.
Timeframes: What They Mean
A timeframe determines how long each candlestick represents.
On a 1-minute chart, each candle covers 60 seconds of trading. On a daily chart, each candle covers one full trading day. The price data is the same underlying market — what changes is the resolution at which you are viewing it.
The most commonly used timeframes in retail trading are:
| Timeframe | Common use |
|---|---|
| Weekly (W) | Long-term directional bias, major structural levels |
| Daily (D) | Primary structural analysis, trend identification |
| 4-Hour (H4) | Swing structure, entry zone context |
| 1-Hour (H1) | Entry timing, intraday structure |
| 15-Minute (M15) | Entry trigger refinement |
| 5-Minute (M5) | Precise entry execution |
The key principle: higher timeframes show larger, slower structures. Lower timeframes show smaller, faster movements nested inside the larger structure.
A daily chart bullish trend contains many smaller up and down movements on the 1-hour chart. A 1-hour chart bearish move might be a brief pullback within the daily uptrend. The same price is visible on both; the interpretation depends on context.
Module 4 covers multi-timeframe analysis in depth. For now, understand that switching between timeframes does not change the market — it changes how much of the market's history you can see in a single view.
Price as Information, Not Instruction
This distinction is one of the most important mental frameworks in this entire course.
When you look at a chart and see a bullish candle form, the candle is not telling you to buy. It is telling you what happened: during this period, buyers were more aggressive than sellers and price closed above where it opened. That is information about past behaviour.
Whether that behaviour will continue, reverse, or accelerate depends on context: what structure looks like on higher timeframes, where key levels are, what session we are in, and whether the move is impulsive or corrective. A single candle without context is almost meaningless.
Beginners frequently make trades based on individual candle patterns in isolation — "that is a hammer, I should buy." A hammer in a strong downtrend with no structural support nearby is not a buy signal. A hammer at a major support zone after a deep pullback in an uptrend is a different observation entirely.
Develop the habit of asking: what does this candle tell me about the current balance of buying and selling pressure? Then ask: does that information confirm or contradict what the broader structure is suggesting?
Lesson Summary
- Every candle records four values: Open, High, Low, Close (OHLC).
- The body shows the distance between open and close. The wicks show how far price extended beyond the body during the period.
- Timeframes determine the resolution of your view, not the underlying market data.
- Price is information about what happened, not an instruction about what to do.
Module 1 Self-Check
Before moving to Module 2, confirm you can do the following:
- Look at any candlestick and identify the open, high, low, and close.
- Explain what a long upper wick indicates about buyer/seller pressure.
- Name the main trading timeframes and state the primary purpose of each.
- Explain in one sentence why a single bullish candle is not automatically a buy signal.
Lesson Objective
By the end of this lesson, you should be able to read any candlestick chart, correctly identify OHLC on individual candles, explain what wicks represent, and state why price should be treated as information rather than instruction.
Get notified when new lessons and content are published.