Course Outline — Lesson 5 of 22 ▼
L2.2 — Trend Structure: Uptrends, Downtrends, and How to Confirm Them
Trend Structure: Uptrends, Downtrends, and How to Confirm Them
Once you can identify swing highs and swing lows, the next step is to read the sequence they form. That sequence is what defines trend direction. This is structural analysis in its most basic and most important form.
The goal of this lesson is to give you a clear, testable definition of trend that does not depend on indicators or subjective interpretation. Either the sequence confirms the trend or it does not.
The Definition of an Uptrend
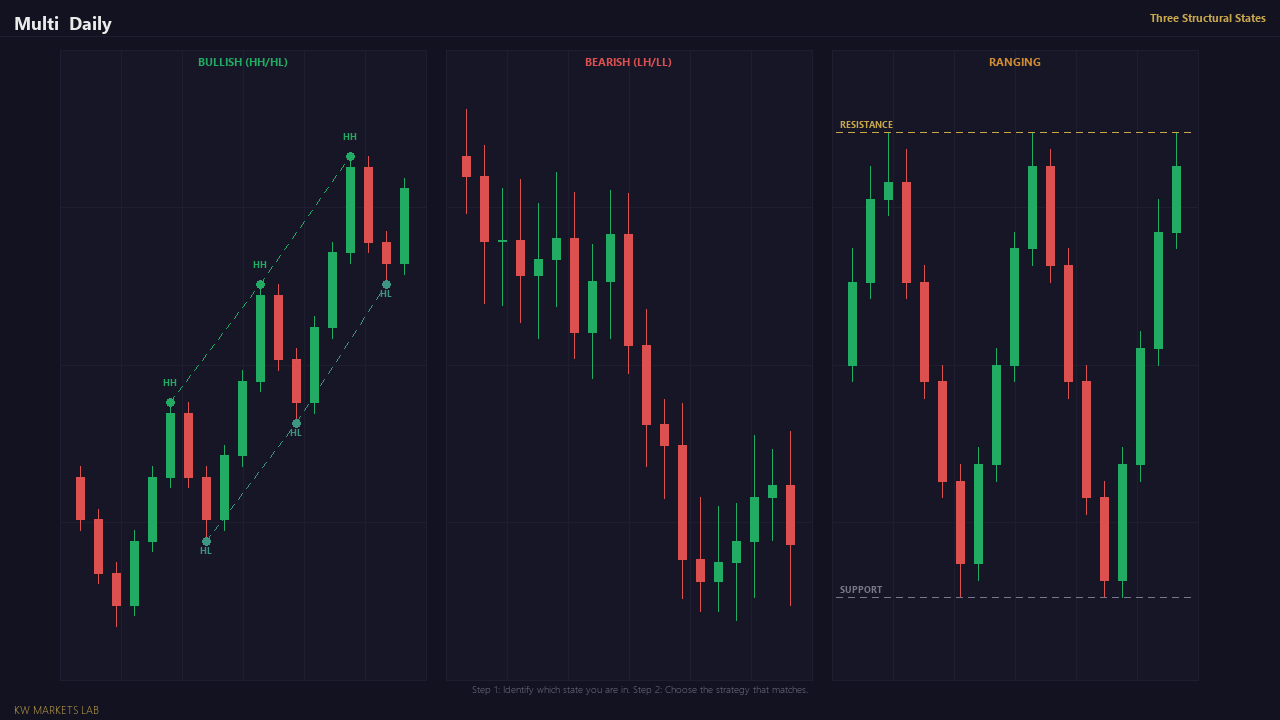
An uptrend is defined by a sequence of higher highs and higher lows.
- Higher High (HH): Each successive swing high is above the previous swing high.
- Higher Low (HL): Each successive swing low is above the previous swing low.
When both conditions are true — each peak is higher than the last, and each trough is higher than the last — the market is making consistent upward progress. This is the definition of a structurally bullish market.
Visually: an uptrend stair-steps upward. Price rallies (forming a new HH), pulls back (but holds above the previous HL), then rallies again to a new HH. The pullbacks do not erase the prior progress.
The Definition of a Downtrend
A downtrend is defined by a sequence of lower highs and lower lows.
- Lower High (LH): Each successive swing high is below the previous swing high.
- Lower Low (LL): Each successive swing low is below the previous swing low.
When both conditions are true, the market is making consistent downward progress. This is the definition of a structurally bearish market.
Visually: a downtrend stair-steps downward. Price falls (forming a new LL), bounces (but fails to reach the previous LH), then falls again to a new LL. The bounces do not recover the prior losses.
What Confirms a Trend
A single higher high does not confirm an uptrend. You need a sequence.
The minimum confirmation is two swing points of the same type progressing in the same direction:
- Two higher highs and two higher lows confirm a developing uptrend.
- Two lower highs and two lower lows confirm a developing downtrend.
More swing points in sequence = stronger confirmation. A daily chart showing five consecutive HH/HL pairs is a strongly confirmed uptrend. A chart showing one marginal new high followed by a slightly higher low is ambiguous and should not be treated as confirmed trend.
The strength of a trend also depends on the quality of the individual moves. In a strong uptrend, the impulsive moves upward (from HL to HH) are larger and faster than the pullbacks (from HH to HL). When the pullbacks begin to equal the impulsive moves in size, the trend is losing momentum and deserves closer attention.
When Neither Condition Is Met: The Range
If price is neither making higher highs and higher lows nor making lower highs and lower lows, it is ranging.
In a range, price moves between a ceiling (resistance) and a floor (support) without making net directional progress. The swing highs and lows are roughly equal in height — neither bulls nor bears are winning the directional argument.
Ranging markets are not necessarily easier to trade. Many strategies that work in trending conditions fail in ranges, and vice versa. Correctly identifying that price is ranging — and adjusting your approach accordingly — is a core part of the framework this course builds.
The question you must answer before any trade is: is this market trending or ranging? Your answer determines whether you look for trend-continuation entries or range-bound entries at extremes.
Choosing a Timeframe for Structural Analysis
Trend identification must be done on a single, committed timeframe. Switching timeframes mid-analysis will always produce contradictions, because structure on a 1-hour chart often moves counter to structure on the daily chart.
The general principle:
- Use the Daily chart for your primary directional bias. A trend on the daily chart represents the dominant medium-term direction.
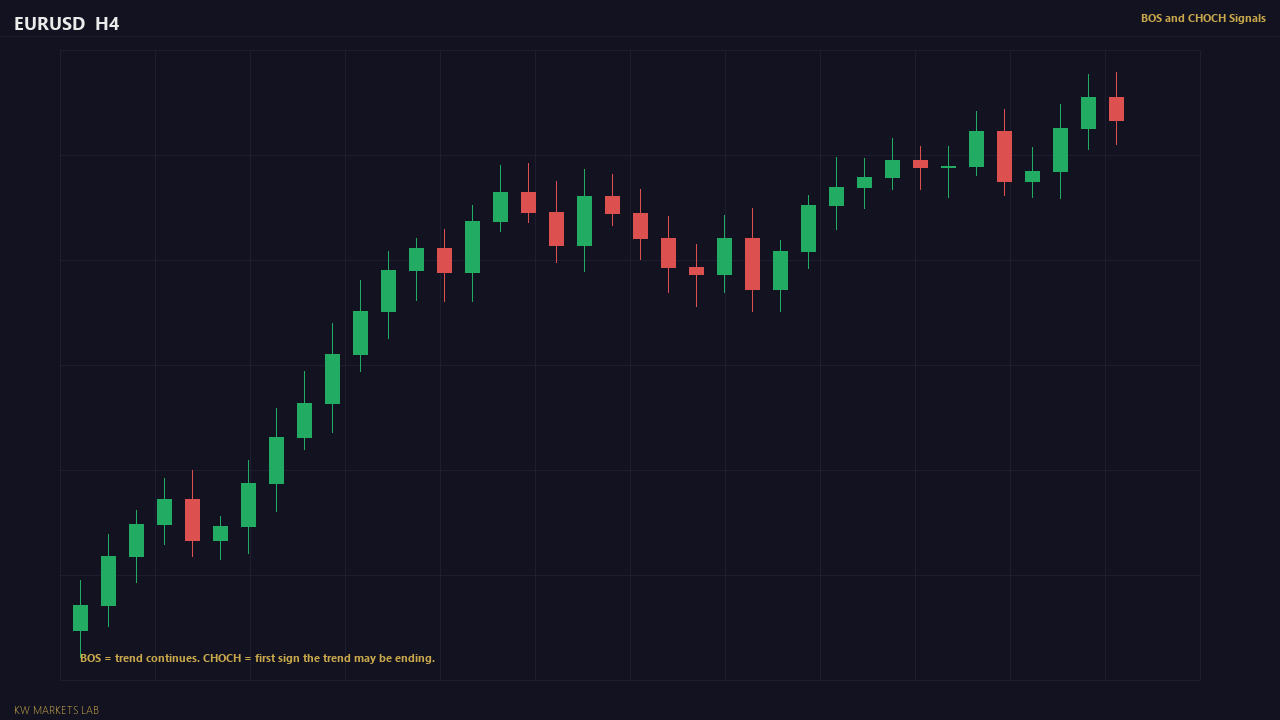
- Use the H4 chart for swing structure within that daily trend.
- Use the H1 or H4 chart for entry zone context.
If the daily chart is in an uptrend, you look for long (buy) setups on the H4. If the H4 is pulling back within that daily uptrend, you wait for the pullback to end and look for long entries at the H4 swing low area.
You do not need to apply this fully yet — Module 4 covers multi-timeframe analysis in detail. For now, practise reading structure on one timeframe at a time, cleanly and consistently.
Common Errors in Trend Identification
Changing the trend label on every candle. A single candle that looks like it might be moving against the trend does not change the structural picture. Trend is determined by the sequence of confirmed swing points, not by individual candles.
Forcing a trend onto a ranging market. Not every chart is trending. If the swing highs and lows are roughly level, the market is ranging. Call it what it is.
Mixing timeframes mid-analysis. If you identified an uptrend on the daily chart and then zoom to the 15-minute to "confirm" it, you will often see 15-minute bearish structure that has nothing to do with the daily picture. Stay on one timeframe for your structural assessment.
Treating pullbacks as reversals. In an uptrend, price pulls back between each HH. These pullbacks are not reversals — they are part of the trend's normal rhythm. A pullback in an uptrend only becomes a concern when it breaks below the most recent HL.
Lesson Summary
- Uptrend = sequence of higher highs and higher lows (HH/HL).
- Downtrend = sequence of lower highs and lower lows (LH/LL).
- Neither = range. Ranging markets require a different approach.
- Confirm a trend with at least two swing points progressing in the same direction.
- Do structural analysis on one committed timeframe — do not mix.
Lesson Objective
By the end of this lesson, you should be able to open any chart, identify the current structural condition (uptrend, downtrend, or range) using only swing highs and swing lows, and explain which specific swing points confirm your assessment.
Get notified when new lessons and content are published.