Intermediate Market Structure Mastery / Module 5: Advanced BOS and CHOCH Lesson 16 of 16
Course Outline — Lesson 16 of 16
M1 Multi-Timeframe Structure Analysis
1 L1.1 — What Market Structure Actually Means 2 L1.2 — Swing Highs, Swing Lows, and How to Mark Them Consistently 3 L1.3 — The Multi-Timeframe Cascade 4 L1.4 — Reading Structure on Higher Timeframes to Filter Lower-Timeframe Noise
M2 Internal vs External Structure
1 L2.1 — External Structure: The Major Swing Points That Define the Trend 2 L2.2 — Internal Structure: Swing Points Within a Trend Leg 3 L2.3 — When Internal Structure Breaks Before External Structure Does
M3 Structure Traps and Liquidity
1 L3.1 — What Is Liquidity and Why Does Price Hunt It? 2 L3.2 — Recognising False Breaks and Stop Hunts at Structure 3 L3.3 — Range Edges and the Liquidity Trap at Equal Highs and Lows
M4 Context and Bias Filtering
1 L4.1 — Building a Daily Directional Bias 2 L4.2 — When to Stand Aside: Markets Not Worth Trading 3 L4.3 — Confluence: When Multiple Structural Factors Align
M5 Advanced BOS and CHOCH
1 L5.1 — Break of Structure vs Change of Character: The Critical Difference 2 L5.2 — Higher-Probability BOS: Quality Filters 3 L5.3 — Structural Analysis in Practice: A Full Worked Example
Lesson 16 of 16

L5.3 — Structural Analysis in Practice: A Full Worked Example

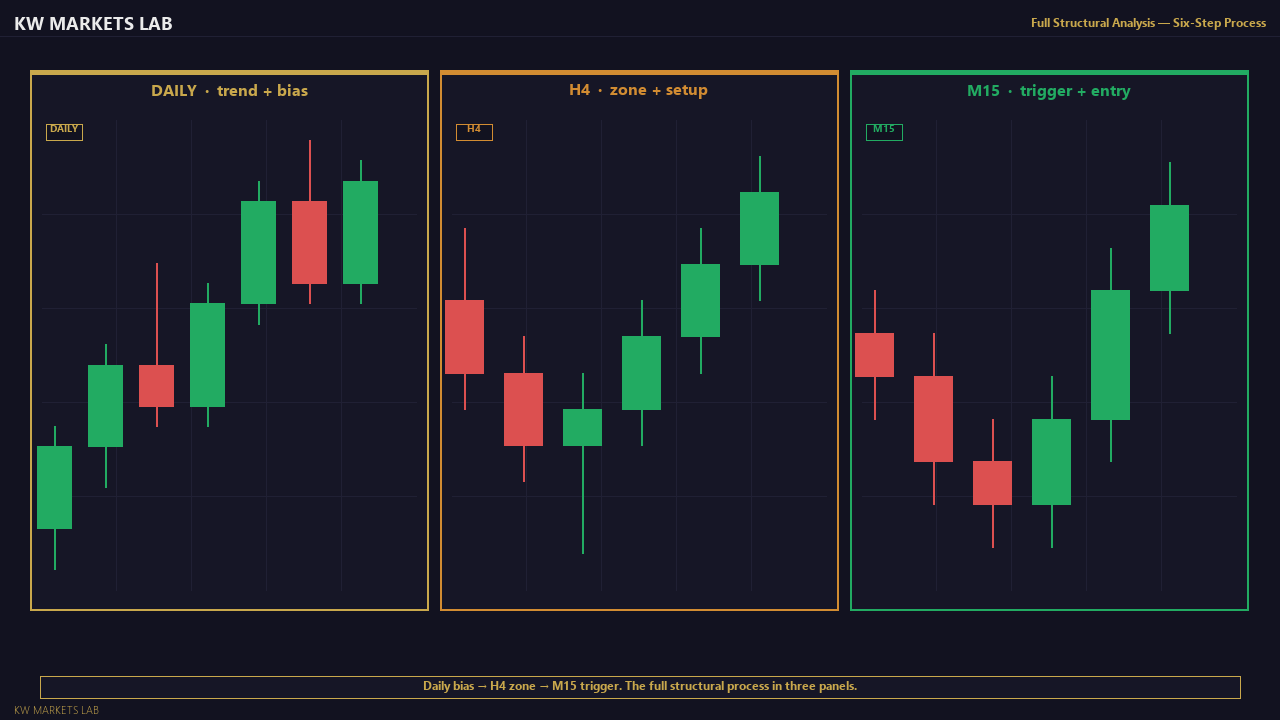
This lesson walks through a complete structural analysis from scratch on a single market. Start on the daily chart. Identify the dominant swing sequence. Mark the most recent external swing high and low. Determine whether the current structure is bullish, bearish, or transitional. Step to H4 and repeat. Step to H1 and identify where price sits within the H4 structure.

The output of this process should be: (1) a directional bias with a clearly stated structural basis, (2) the key level being watched, and (3) the condition that would confirm or invalidate the bias. If you cannot produce all three, you are not yet ready to trade that market.

Full Structural Analysis — Chart View
Full Structural Analysis — Chart ViewDaily bias, H4 zone, M15 trigger. The full structural process in three panels.

The goal of this walkthrough is not to show you a trade. It is to demonstrate the repeatable analytical process that produces consistent structural reads regardless of the market or timeframe. Apply this process every session on a market you are watching and the quality of your structural reads will compound over time.

Course Complete — Next in Path
Learn the three entry models, confirmation triggers, and exe →
Stay Updated

Get notified when new lessons and content are published.