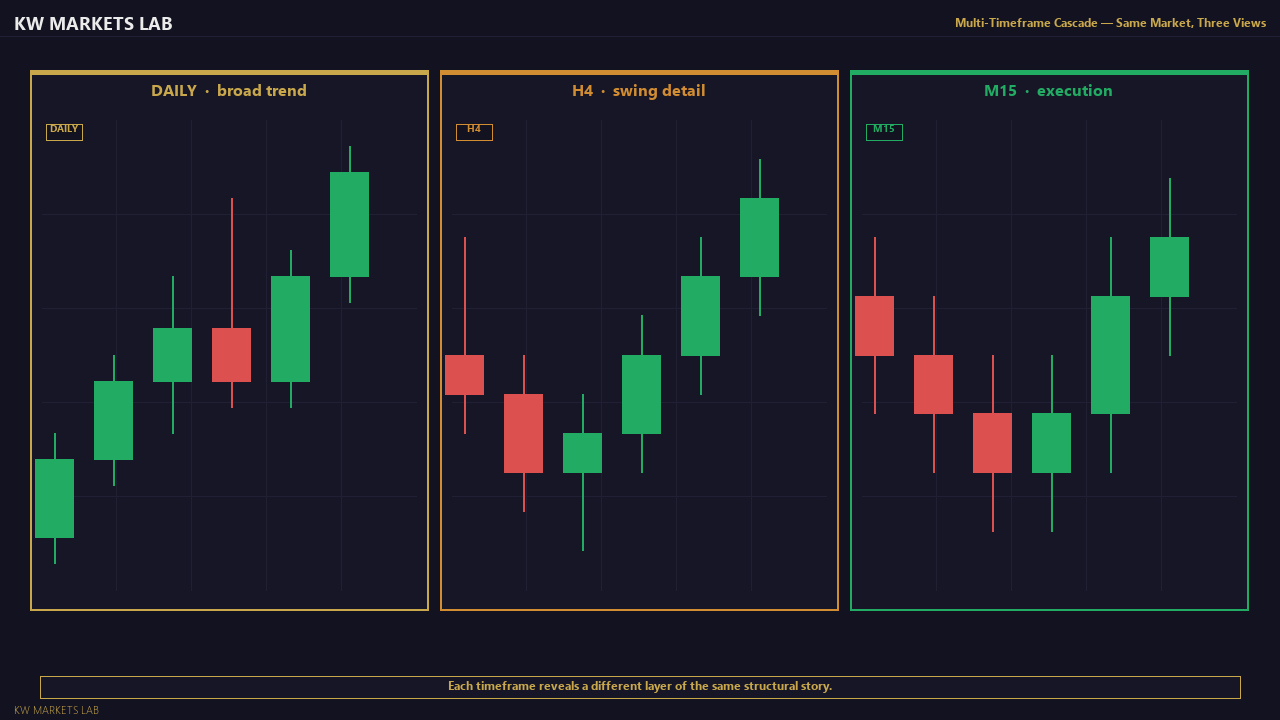
L1.3 — The Multi-Timeframe Cascade
Price is fractal. The same structural patterns that appear on the daily chart exist on the hourly chart, and within that on the 15-minute chart. The multi-timeframe cascade is the process of reading structure top-down: starting on the highest relevant timeframe to establish directional context, then stepping down to find your operational timeframe, then dropping to the entry timeframe to time your execution.
A common framework is Daily → H4 → H1 for swing traders, or H4 → H1 → M15 for intraday traders. The key rule: the higher timeframe always has authority over the lower. If daily structure is bearish, a bullish setup on the H1 is a counter-trend trade — higher risk, lower probability, requires extra confirmation.
The cascade is not about finding three timeframes that agree. It is about understanding which direction has the weight of structure behind it, and only trading setups that align with that weight. A setup that aligns with structure on all three timeframes is rare — but when it occurs, the quality of the opportunity is significantly higher than a single-timeframe read.
Get notified when new lessons and content are published.