L1.2 — Swing Highs, Swing Lows, and How to Mark Them Consistently
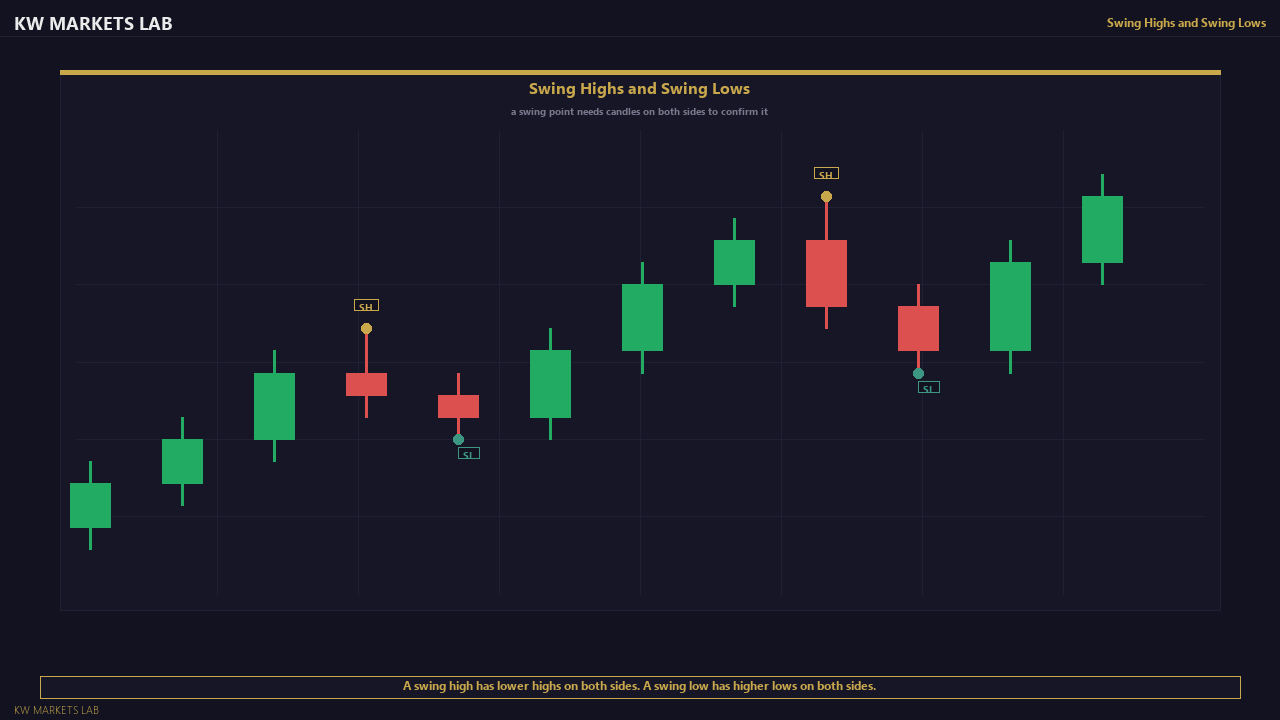
A swing high is a candle (or group of candles) with a peak that is higher than both the candles immediately to its left and its right. A swing low is the mirror: a trough lower than its neighbours. These are the building blocks of structure. If you cannot identify them consistently, everything built on top of them will be inconsistent too.
The most common mistake is marking every minor fluctuation as a swing point. This creates a chart full of noise with no clear structure. The rule is to mark swing points that are significant relative to the timeframe you are reading. On the daily chart, a swing high is formed by a visible price peak with at least two lower-high candles on either side. On the 15-minute chart, the same logic applies at a smaller scale.
Once you can mark swing points cleanly and consistently, you can read a trend: a series of higher highs and higher lows is bullish structure; lower highs and lower lows is bearish. This is not a predictive tool — it is a diagnostic. You are reading what has happened so you can trade in the direction of least resistance rather than against it.
Get notified when new lessons and content are published.