Intermediate Market Structure Mastery / Module 1: Multi-Timeframe Structure Analysis Lesson 1 of 16
Course Outline — Lesson 1 of 16
M1 Multi-Timeframe Structure Analysis
1 L1.1 — What Market Structure Actually Means 2 L1.2 — Swing Highs, Swing Lows, and How to Mark Them Consistently 3 L1.3 — The Multi-Timeframe Cascade 4 L1.4 — Reading Structure on Higher Timeframes to Filter Lower-Timeframe Noise
M2 Internal vs External Structure
1 L2.1 — External Structure: The Major Swing Points That Define the Trend 2 L2.2 — Internal Structure: Swing Points Within a Trend Leg 3 L2.3 — When Internal Structure Breaks Before External Structure Does
M3 Structure Traps and Liquidity
1 L3.1 — What Is Liquidity and Why Does Price Hunt It? 2 L3.2 — Recognising False Breaks and Stop Hunts at Structure 3 L3.3 — Range Edges and the Liquidity Trap at Equal Highs and Lows
M4 Context and Bias Filtering
1 L4.1 — Building a Daily Directional Bias 2 L4.2 — When to Stand Aside: Markets Not Worth Trading 3 L4.3 — Confluence: When Multiple Structural Factors Align
M5 Advanced BOS and CHOCH
1 L5.1 — Break of Structure vs Change of Character: The Critical Difference 2 L5.2 — Higher-Probability BOS: Quality Filters 3 L5.3 — Structural Analysis in Practice: A Full Worked Example
Lesson 1 of 16

L1.1 — What Market Structure Actually Means

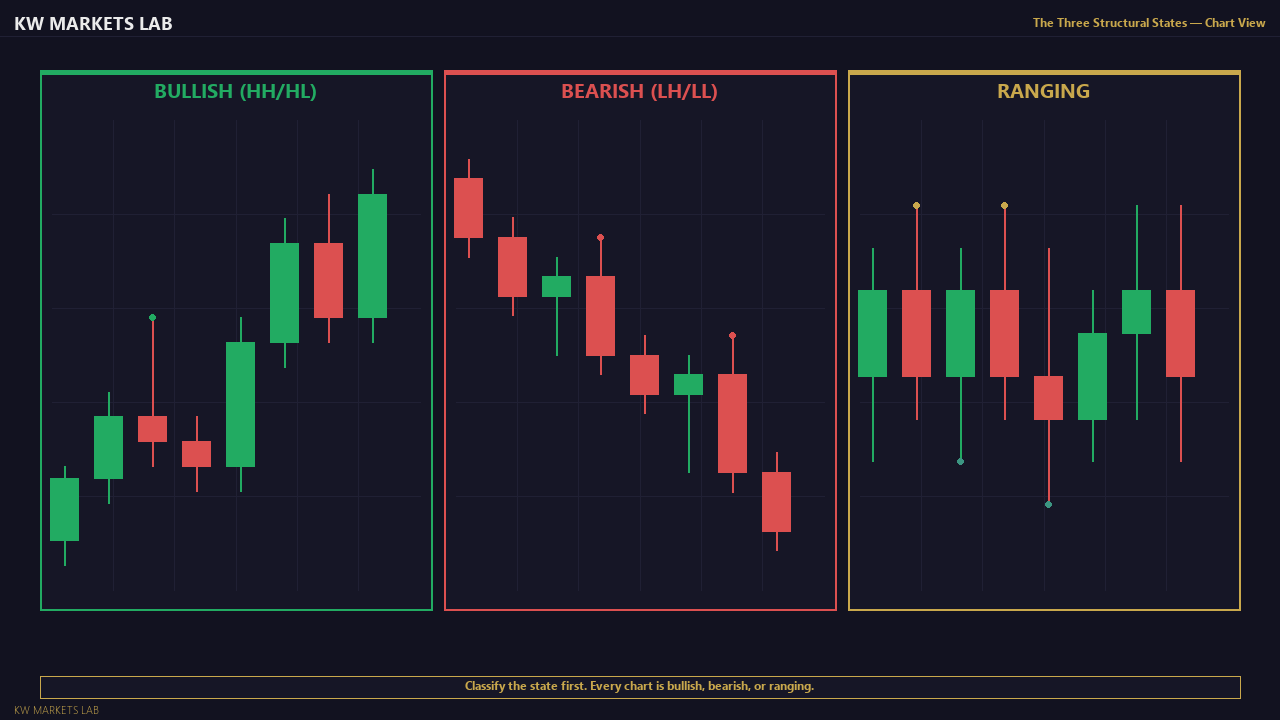
Market structure is not a trading strategy — it is a description of what price has already done. Every chart tells a story through a sequence of swing highs and swing lows. When those highs and lows are making higher peaks and higher troughs, structure is bullish. When they are making lower peaks and lower troughs, structure is bearish. When they are oscillating between a ceiling and a floor, structure is ranging. This is not a system to learn — it is a reading skill to develop.

The problem most traders have is that they look at structure in isolation on a single timeframe and expect it to predict price. It does not. Structure describes context. It tells you what environment you are operating in so you can choose whether a setup is worth taking, not whether a trade will win.

The Three Structural States — Chart View
The Three Structural States — Chart ViewClassify the state first. Every chart is bullish, bearish, or ranging.

Every professional analytical process begins with structure. Before you mark a level, before you identify a setup, before you consider an entry — you need to know what the chart is doing. Trend, range, or transition: this is always the first question. This lesson gives you the framework for answering it.

Continue Learning
L1.2 — Swing Highs, Swing Lows, and How to Mark Them Consistently →
Stay Updated

Get notified when new lessons and content are published.