Intermediate Market Structure Mastery / Module 4: Context and Bias Filtering Lesson 11 of 16
Course Outline — Lesson 11 of 16
M1 Multi-Timeframe Structure Analysis
1 L1.1 — What Market Structure Actually Means 2 L1.2 — Swing Highs, Swing Lows, and How to Mark Them Consistently 3 L1.3 — The Multi-Timeframe Cascade 4 L1.4 — Reading Structure on Higher Timeframes to Filter Lower-Timeframe Noise
M2 Internal vs External Structure
1 L2.1 — External Structure: The Major Swing Points That Define the Trend 2 L2.2 — Internal Structure: Swing Points Within a Trend Leg 3 L2.3 — When Internal Structure Breaks Before External Structure Does
M3 Structure Traps and Liquidity
1 L3.1 — What Is Liquidity and Why Does Price Hunt It? 2 L3.2 — Recognising False Breaks and Stop Hunts at Structure 3 L3.3 — Range Edges and the Liquidity Trap at Equal Highs and Lows
M4 Context and Bias Filtering
1 L4.1 — Building a Daily Directional Bias 2 L4.2 — When to Stand Aside: Markets Not Worth Trading 3 L4.3 — Confluence: When Multiple Structural Factors Align
M5 Advanced BOS and CHOCH
1 L5.1 — Break of Structure vs Change of Character: The Critical Difference 2 L5.2 — Higher-Probability BOS: Quality Filters 3 L5.3 — Structural Analysis in Practice: A Full Worked Example
Lesson 11 of 16

L4.1 — Building a Daily Directional Bias

A directional bias is not a trade. It is a structural conclusion: given what price has done and where it currently sits, which direction has the higher probability of continuation? A bullish bias means you are looking for longs at structure, not shorts. A bearish bias means the opposite. A neutral bias means you wait.

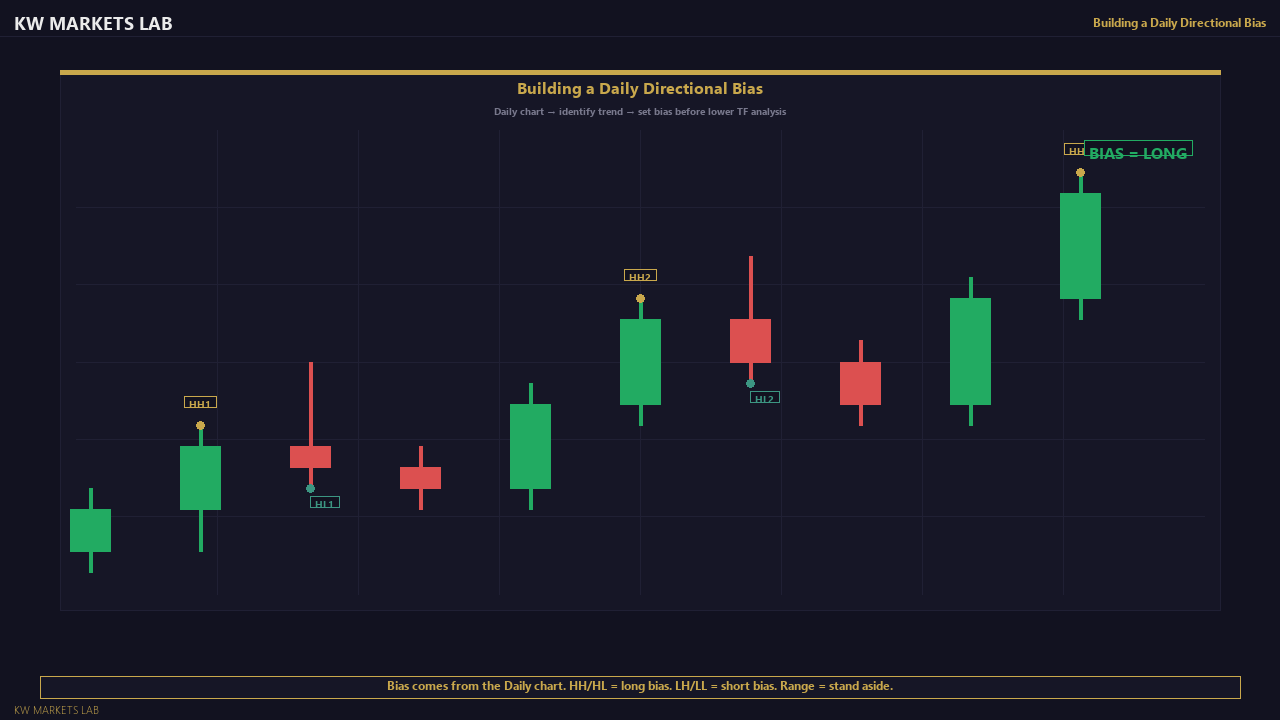
Building a daily bias begins on the daily chart: what is the trend? Where is price relative to the last key swing? Then step to H4: is price in a pullback within the trend, or is it pressing into the direction of the trend? Then mark the key level you are watching and define the condition that would confirm or invalidate your bias.

Daily Directional Bias — Chart View
Daily Directional Bias — Chart ViewBias comes from the Daily chart. HH/HL = long bias. LH/LL = short bias.

The bias is not permanent. It is a working hypothesis that gets updated when structure gives you new information — specifically when a BOS or CHOCH occurs on the higher timeframe. Until that happens, you trade with the existing bias, not against it.

Continue Learning
L4.2 — When to Stand Aside: Markets Not Worth Trading →
Stay Updated

Get notified when new lessons and content are published.