Intermediate Market Structure Mastery / Module 1: Multi-Timeframe Structure Analysis Lesson 4 of 16
Course Outline — Lesson 4 of 16
M1 Multi-Timeframe Structure Analysis
1 L1.1 — What Market Structure Actually Means 2 L1.2 — Swing Highs, Swing Lows, and How to Mark Them Consistently 3 L1.3 — The Multi-Timeframe Cascade 4 L1.4 — Reading Structure on Higher Timeframes to Filter Lower-Timeframe Noise
M2 Internal vs External Structure
1 L2.1 — External Structure: The Major Swing Points That Define the Trend 2 L2.2 — Internal Structure: Swing Points Within a Trend Leg 3 L2.3 — When Internal Structure Breaks Before External Structure Does
M3 Structure Traps and Liquidity
1 L3.1 — What Is Liquidity and Why Does Price Hunt It? 2 L3.2 — Recognising False Breaks and Stop Hunts at Structure 3 L3.3 — Range Edges and the Liquidity Trap at Equal Highs and Lows
M4 Context and Bias Filtering
1 L4.1 — Building a Daily Directional Bias 2 L4.2 — When to Stand Aside: Markets Not Worth Trading 3 L4.3 — Confluence: When Multiple Structural Factors Align
M5 Advanced BOS and CHOCH
1 L5.1 — Break of Structure vs Change of Character: The Critical Difference 2 L5.2 — Higher-Probability BOS: Quality Filters 3 L5.3 — Structural Analysis in Practice: A Full Worked Example
Lesson 4 of 16

L1.4 — Reading Structure on Higher Timeframes to Filter Lower-Timeframe Noise

Lower timeframes are full of noise. Every 5-minute chart contains dozens of mini-swings, local reversals, and structural patterns that have no significance on the bigger picture. The purpose of higher-timeframe analysis is not to find more setups — it is to filter out the weak ones.

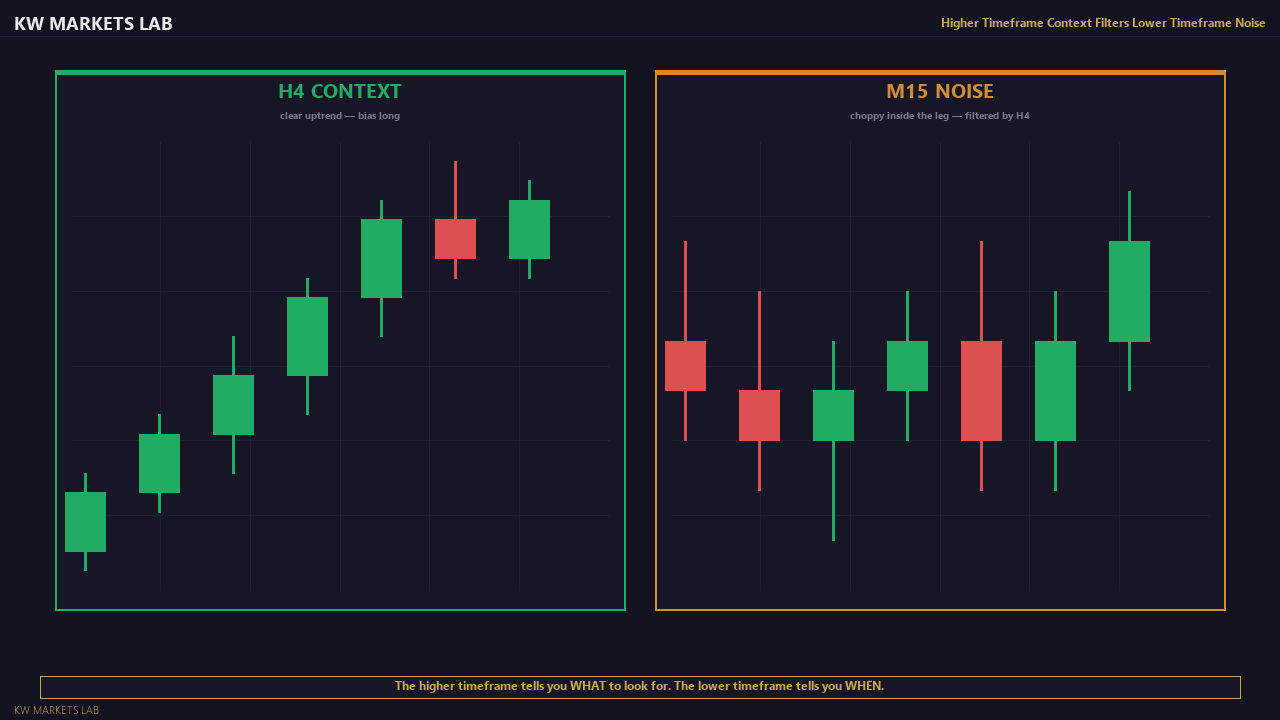
The practical process: mark the current structure on the daily and H4 charts before you ever open the H1 or M15. Identify where price is within that larger structure — is it at a key level, in the middle of a range, or in a strong trending leg? This single step eliminates the majority of low-quality setups that look compelling on the lower timeframe but have no structural backing from above.

Higher Timeframe Context Filter — Chart View
Higher Timeframe Context Filter — Chart ViewThe higher timeframe tells you WHAT to look for. The lower timeframe tells you WHEN.

A useful diagnostic: if you cannot explain in one sentence what the daily chart is doing and where price currently sits within that structure, you are not ready to trade that market that day. Structure literacy at the higher timeframe is the prerequisite for everything else in this course.

Continue Learning
L2.1 — External Structure: The Major Swing Points That Define the Trend →
Stay Updated

Get notified when new lessons and content are published.