Intermediate Market Structure Mastery / Module 3: Structure Traps and Liquidity Lesson 9 of 16
Course Outline — Lesson 9 of 16
M1 Multi-Timeframe Structure Analysis
1 L1.1 — What Market Structure Actually Means 2 L1.2 — Swing Highs, Swing Lows, and How to Mark Them Consistently 3 L1.3 — The Multi-Timeframe Cascade 4 L1.4 — Reading Structure on Higher Timeframes to Filter Lower-Timeframe Noise
M2 Internal vs External Structure
1 L2.1 — External Structure: The Major Swing Points That Define the Trend 2 L2.2 — Internal Structure: Swing Points Within a Trend Leg 3 L2.3 — When Internal Structure Breaks Before External Structure Does
M3 Structure Traps and Liquidity
1 L3.1 — What Is Liquidity and Why Does Price Hunt It? 2 L3.2 — Recognising False Breaks and Stop Hunts at Structure 3 L3.3 — Range Edges and the Liquidity Trap at Equal Highs and Lows
M4 Context and Bias Filtering
1 L4.1 — Building a Daily Directional Bias 2 L4.2 — When to Stand Aside: Markets Not Worth Trading 3 L4.3 — Confluence: When Multiple Structural Factors Align
M5 Advanced BOS and CHOCH
1 L5.1 — Break of Structure vs Change of Character: The Critical Difference 2 L5.2 — Higher-Probability BOS: Quality Filters 3 L5.3 — Structural Analysis in Practice: A Full Worked Example
Lesson 9 of 16

L3.2 — Recognising False Breaks and Stop Hunts at Structure

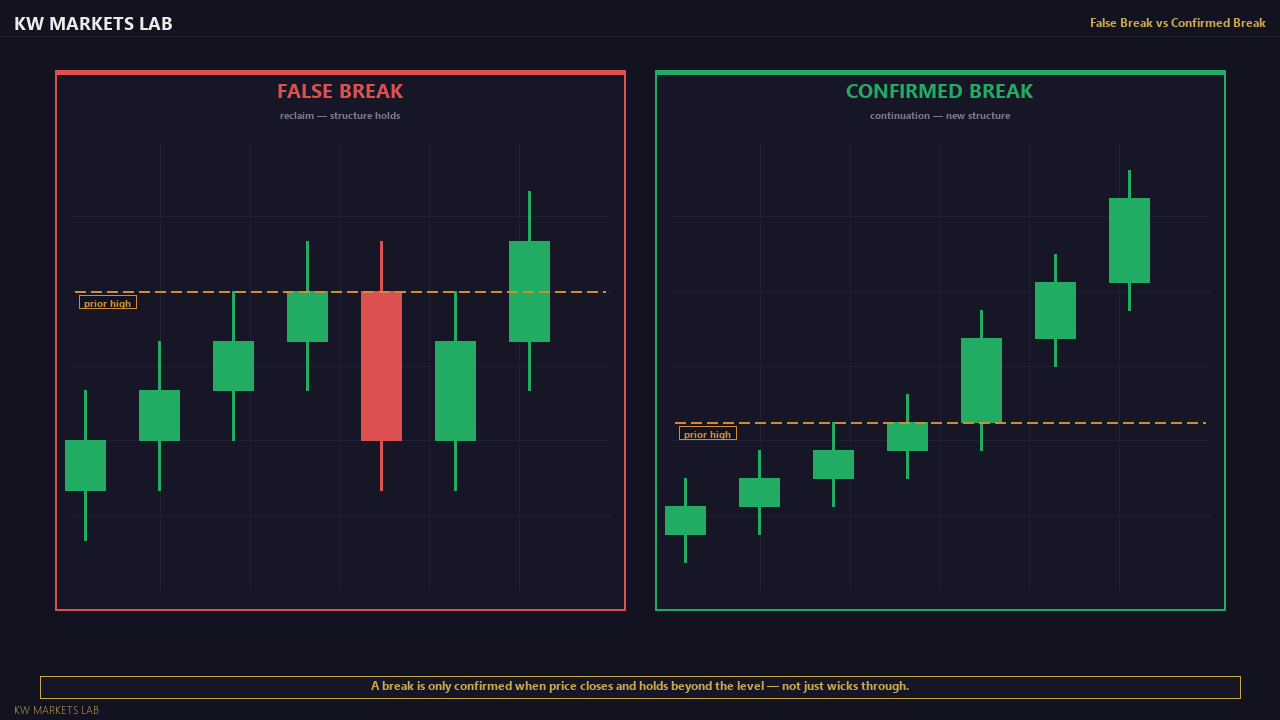
A false break is when price penetrates a swing point or key level but then reverses before closing beyond it. On a candlestick chart, this produces a wick that extends beyond the level with a body that closes back inside the range. This is the most common form of a stop hunt in normal market conditions.

The key diagnostic: was the break confirmed by a candle body close beyond the level, or was it a wick-only penetration? A wick-only penetration at a key structural level — particularly one that snaps back quickly — is a strong signal that the level was swept for liquidity rather than genuinely broken. No structural update is warranted.

False Break vs Confirmed Break — Chart View
False Break vs Confirmed Break — Chart ViewA break is only confirmed when price closes and holds beyond the level.

The practical implication: do not move your structural labels or invalidate your bias on a wick. Wait for a candle close. This single rule prevents the majority of false-break misreads that cause traders to flip their bias at the worst possible moment — just as price is about to resume the original trend direction.

Continue Learning
L3.3 — Range Edges and the Liquidity Trap at Equal Highs and Lows →
Stay Updated

Get notified when new lessons and content are published.