Intermediate Market Structure Mastery / Module 3: Structure Traps and Liquidity Lesson 8 of 16
Course Outline — Lesson 8 of 16
M1 Multi-Timeframe Structure Analysis
1 L1.1 — What Market Structure Actually Means 2 L1.2 — Swing Highs, Swing Lows, and How to Mark Them Consistently 3 L1.3 — The Multi-Timeframe Cascade 4 L1.4 — Reading Structure on Higher Timeframes to Filter Lower-Timeframe Noise
M2 Internal vs External Structure
1 L2.1 — External Structure: The Major Swing Points That Define the Trend 2 L2.2 — Internal Structure: Swing Points Within a Trend Leg 3 L2.3 — When Internal Structure Breaks Before External Structure Does
M3 Structure Traps and Liquidity
1 L3.1 — What Is Liquidity and Why Does Price Hunt It? 2 L3.2 — Recognising False Breaks and Stop Hunts at Structure 3 L3.3 — Range Edges and the Liquidity Trap at Equal Highs and Lows
M4 Context and Bias Filtering
1 L4.1 — Building a Daily Directional Bias 2 L4.2 — When to Stand Aside: Markets Not Worth Trading 3 L4.3 — Confluence: When Multiple Structural Factors Align
M5 Advanced BOS and CHOCH
1 L5.1 — Break of Structure vs Change of Character: The Critical Difference 2 L5.2 — Higher-Probability BOS: Quality Filters 3 L5.3 — Structural Analysis in Practice: A Full Worked Example
Lesson 8 of 16

L3.1 — What Is Liquidity and Why Does Price Hunt It?

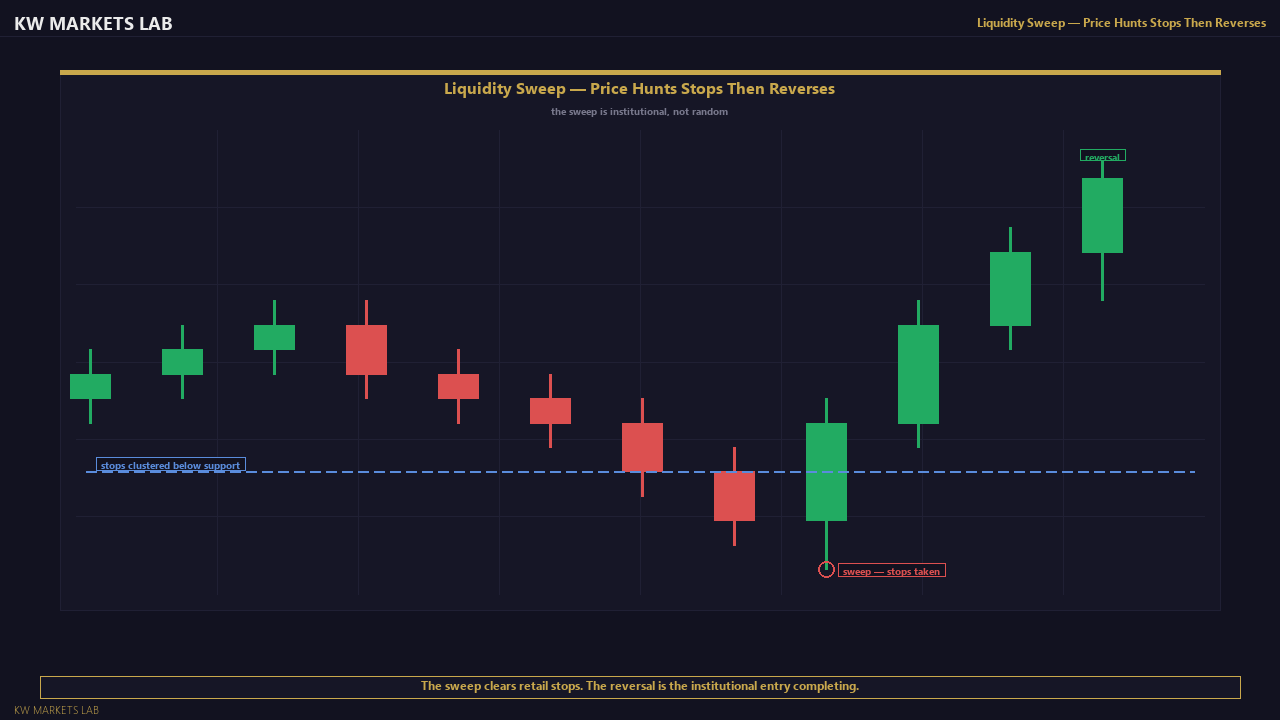
Liquidity in the context of price action refers to clusters of pending orders sitting at predictable levels in the market. Stop-losses placed below swing lows by long traders, and above swing highs by short traders, create dense order clusters that institutional participants will route price through when they need to fill large positions.

This is not a conspiracy theory — it is mechanics. A large buy order needs willing sellers to fill against. The most willing sellers (and the most available supply of sell orders) are the stop-losses of losing long positions sitting below a key swing low. Routing price through that level triggers those stops and simultaneously fills the large buy order at a favourable price.

Liquidity Sweep — Chart View
Liquidity Sweep — Chart ViewThe sweep clears retail stops. The reversal is the institutional entry completing.

Understanding this dynamic does not mean you can predict every sweep. It means you stop treating stop hunts as random market malice and start factoring them into your structural analysis — particularly at clean equal highs/lows, round numbers, and obvious previous swing points where retail stop clusters are predictably dense.

Continue Learning
L3.2 — Recognising False Breaks and Stop Hunts at Structure →
Stay Updated

Get notified when new lessons and content are published.