Intermediate Market Structure Mastery / Module 3: Structure Traps and Liquidity Lesson 10 of 16
Course Outline — Lesson 10 of 16
M1 Multi-Timeframe Structure Analysis
1 L1.1 — What Market Structure Actually Means 2 L1.2 — Swing Highs, Swing Lows, and How to Mark Them Consistently 3 L1.3 — The Multi-Timeframe Cascade 4 L1.4 — Reading Structure on Higher Timeframes to Filter Lower-Timeframe Noise
M2 Internal vs External Structure
1 L2.1 — External Structure: The Major Swing Points That Define the Trend 2 L2.2 — Internal Structure: Swing Points Within a Trend Leg 3 L2.3 — When Internal Structure Breaks Before External Structure Does
M3 Structure Traps and Liquidity
1 L3.1 — What Is Liquidity and Why Does Price Hunt It? 2 L3.2 — Recognising False Breaks and Stop Hunts at Structure 3 L3.3 — Range Edges and the Liquidity Trap at Equal Highs and Lows
M4 Context and Bias Filtering
1 L4.1 — Building a Daily Directional Bias 2 L4.2 — When to Stand Aside: Markets Not Worth Trading 3 L4.3 — Confluence: When Multiple Structural Factors Align
M5 Advanced BOS and CHOCH
1 L5.1 — Break of Structure vs Change of Character: The Critical Difference 2 L5.2 — Higher-Probability BOS: Quality Filters 3 L5.3 — Structural Analysis in Practice: A Full Worked Example
Lesson 10 of 16

L3.3 — Range Edges and the Liquidity Trap at Equal Highs and Lows

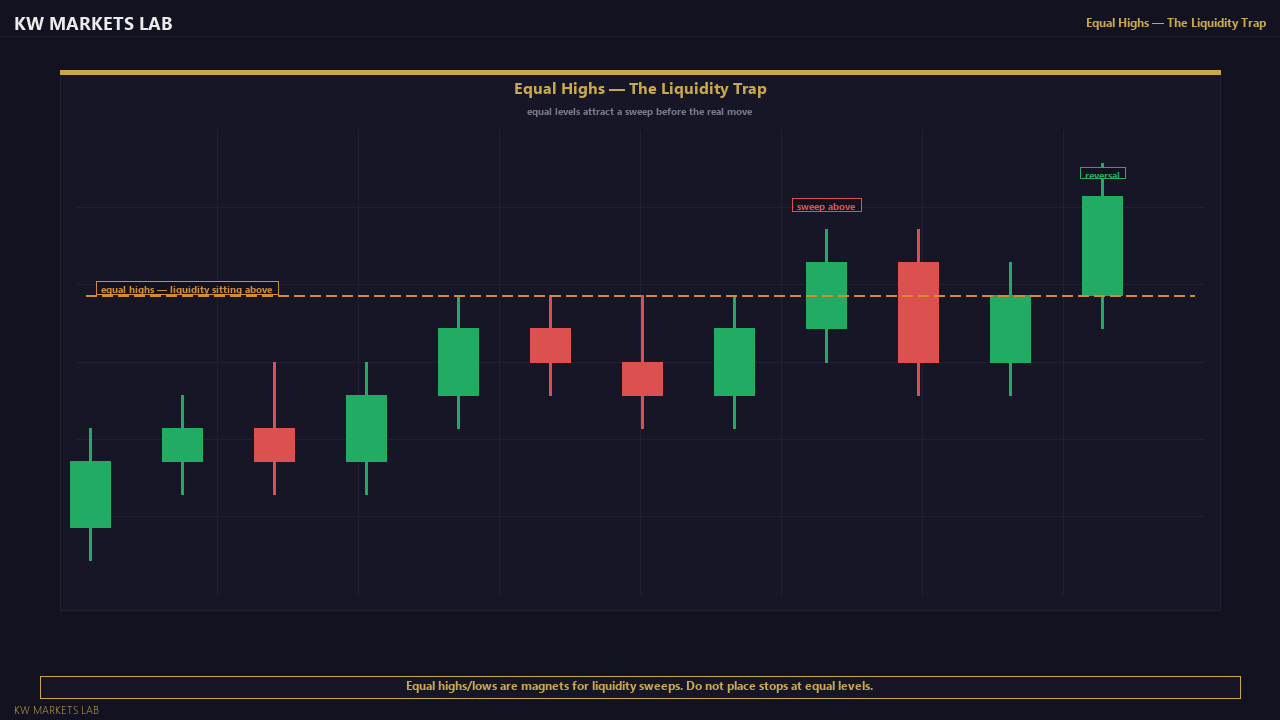
Equal highs and equal lows — where price tags the same level multiple times without breaking through — are among the highest-probability liquidity targets in the market. Every touch of that level places another set of stops just beyond it. By the time a level has been tested three or four times, the cluster of stops above a range high or below a range low is substantial.

The trap is that a clean break of equal highs looks exactly like a legitimate breakout. Price breaks above the range, traders chase the breakout, and then price reverses back into the range leaving those traders trapped. This is not guaranteed to happen every time, but the probability is high enough that an experienced analyst approaches clean equal highs and lows with extreme caution rather than breakout enthusiasm.

Equal Highs Liquidity Trap — Chart View
Equal Highs Liquidity Trap — Chart ViewEqual highs/lows are magnets for liquidity sweeps. Do not place stops at equal levels.

The defensive rule: when a level has been tested multiple times, do not trade the initial break — wait for the breakout candle to close, then watch for whether price holds the broken level on the first pullback. A genuine breakout holds the level. A liquidity sweep reverses quickly and closes back inside the range.

Continue Learning
L4.1 — Building a Daily Directional Bias →
Stay Updated

Get notified when new lessons and content are published.