L2.3 — Win Rate vs Expectancy: Reading Your Own Performance Data
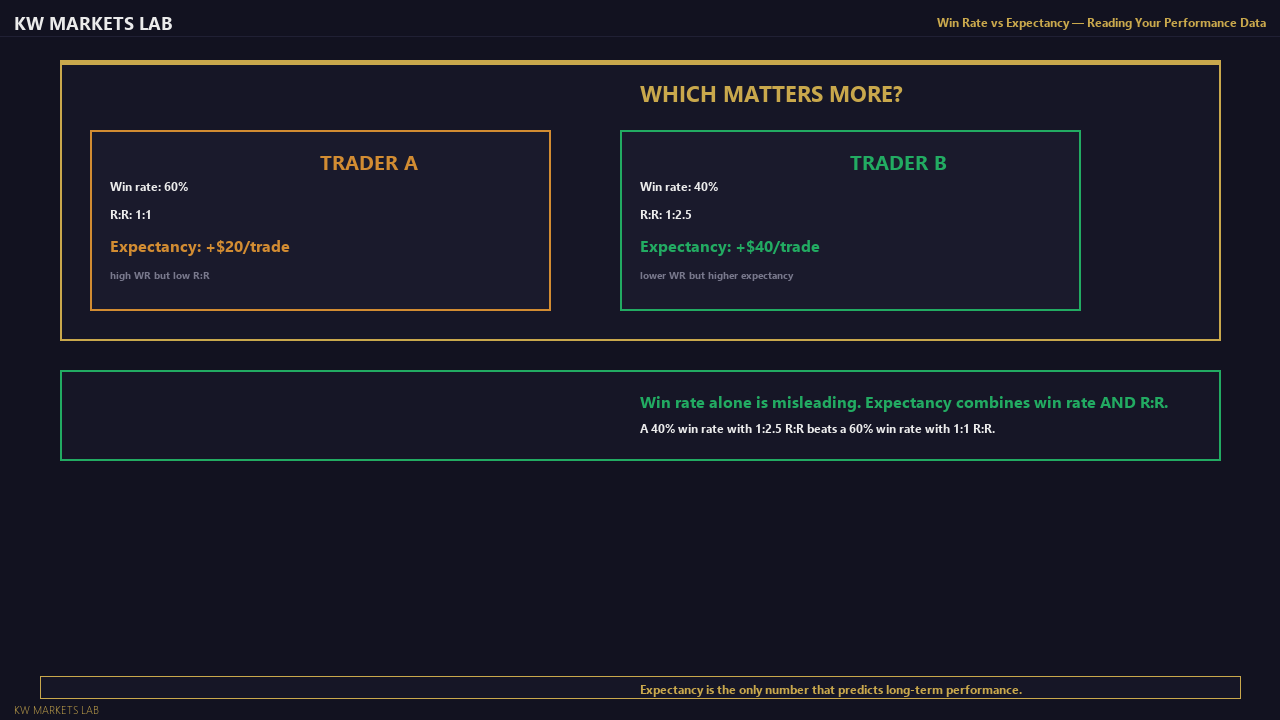
Two traders with the same 45% win rate can have very different expectancy. Trader A: average win 2R, average loss 1R. Expectancy: (0.45 x 2) - (0.55 x 1) = +0.35R per trade. Profitable. Trader B: average win 0.8R, average loss 1.2R. Expectancy: (0.45 x 0.8) - (0.55 x 1.2) = -0.3R per trade. Unprofitable. Both have the same win rate. The difference is the size of wins versus losses — which is controlled by management, not by analysis.
The most actionable insight from this comparison: if your expectancy is negative despite a reasonable win rate, examine your average win versus average loss. Premature exits, moved targets, and partials taken too early are the mechanisms that compress average wins below average losses.
Calculate your own expectancy from your trade log. If it is positive, identify what produces your best winners and protect those conditions. If it is negative, identify whether the problem is win rate, reward quality, or both — and address the specific issue rather than changing the entire strategy.
Get notified when new lessons and content are published.