Advanced XAUUSD Gold Specialization / Module 1: Gold Behaviour and Volatility Profile Lesson 3 of 16
Course Outline — Lesson 3 of 16
M1 Gold Behaviour and Volatility Profile
1 L1.1 — Why Gold Behaves Differently from Forex Pairs 2 L1.2 — What Drives Gold Price: Macro Context for Technical Traders 3 L1.3 — Gold Volatility Profile: ATR, Wicks, and Typical Session Ranges 4 L1.4 — Spread, Commission, and the True Cost of Trading Gold
M2 Key Gold Setups
1 L2.1 — The Top-Down Gold Setup: Daily Bias to H1 Entry 2 L2.2 — Asian Range Breakout Setups on Gold 3 L2.3 — Gold BOS Continuation: Adapting the Framework to Gold's Profile
M3 Session Behaviour on XAUUSD
1 L3.1 — Asian Session: Consolidation, Range Identification, and Patience 2 L3.2 — London Session: Expansion, Direction, and Entry Windows 3 L3.3 — New York Session: Continuation vs Reversal Decision Points
M4 Risk Management for Gold
1 L4.1 — Position Sizing for Gold: Accounting for Pip Value 2 L4.2 — Managing Around Gold-Specific Risk Events 3 L4.3 — Gold-Specific Stop Placement: Buffering for Wicks
M5 Gold-Specific Case Studies
1 L5.1 — Case Study: Clean Bullish BOS on H4 Gold 2 L5.2 — Case Study: Asian Range Sweep and London Reversal 3 L5.3 — Case Study: Gold During a High-Impact News Event
Lesson 3 of 16

L1.3 — Gold Volatility Profile: ATR, Wicks, and Typical Session Ranges

The Average True Range (ATR) on gold varies significantly by session. The Asian session typically produces 200-400 pip daily ATR (in gold pips — remember, these are $0.01 increments). London open expands this sharply. A full day's ATR on gold in a trending environment can be 1,500-2,000 gold pips. Understanding the typical ATR for the current market condition helps you set stop distances that reflect real market behaviour rather than arbitrary pip counts.

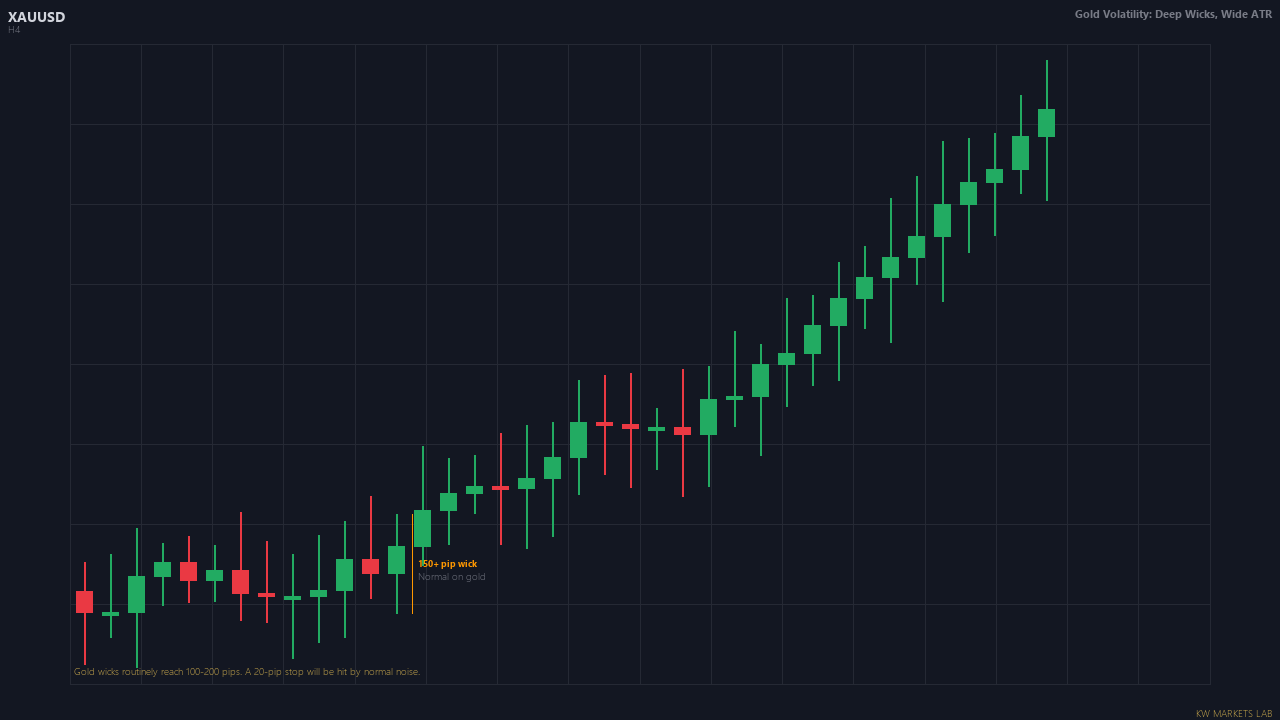
Gold produces longer wicks relative to candle bodies than most forex pairs. This is important for stop placement: a stop placed just below a structural level may get clipped by a gold wick that would not have triggered the same stop on EURUSD. Add buffer to structural stops on gold — minimum 20-30 gold pips beyond the structural level — and accept that the wider stop requires a proportionally wider target.

ATR comparison bar chart and wick depth reference with stop placement implications.
Gold Volatility: Deep Wicks, Wide ATRGold wicks routinely reach 100-200 pips. A 20-pip stop on gold is not a stop — it will be hit by normal noise.

Track the ATR on your gold chart as a permanent display. When current ATR is significantly above the 14-period average, conditions are unusually volatile — reduce position size or increase stop buffer. When ATR is significantly below average, gold is in a compression phase and breakouts are likely imminent — but the direction cannot be predicted from ATR alone.

Continue Learning
L1.4 — Spread, Commission, and the True Cost of Trading Gold →
Stay Updated

Get notified when new lessons and content are published.