
Overview
This framework looks for continuation after a confirmed break of higher-timeframe structure. The idea is to align with the dominant trend, wait for a pullback into a meaningful area, and only look for entries if the market continues to respect bullish or bearish structure. Best used when the trend is already established and not in messy range conditions.
Before using this strategy:
When to Use This Strategy
- ✓Daily or H4 shows clear HH/HL or LH/LL trending structure
- ✓A significant swing point has been broken by a candle body close
- ✓Price is pulling back toward the broken level for a retest
- ✓London or New York session is active
When NOT to Use It
- ✗Daily structure is ranging or ambiguous
- ✗The break was wick-only (no body close beyond)
- ✗High-impact news event within 30 minutes of the retest
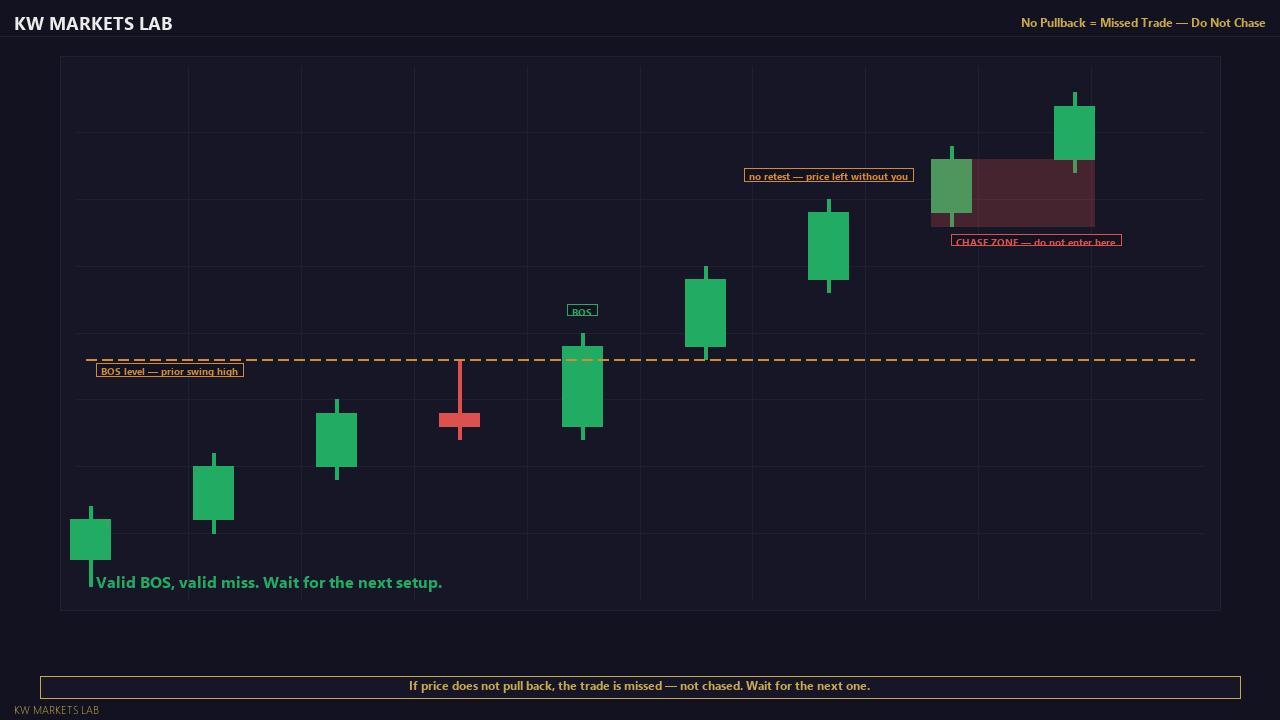
- ✗Price has already moved past the retest without pulling back
Framework Overview
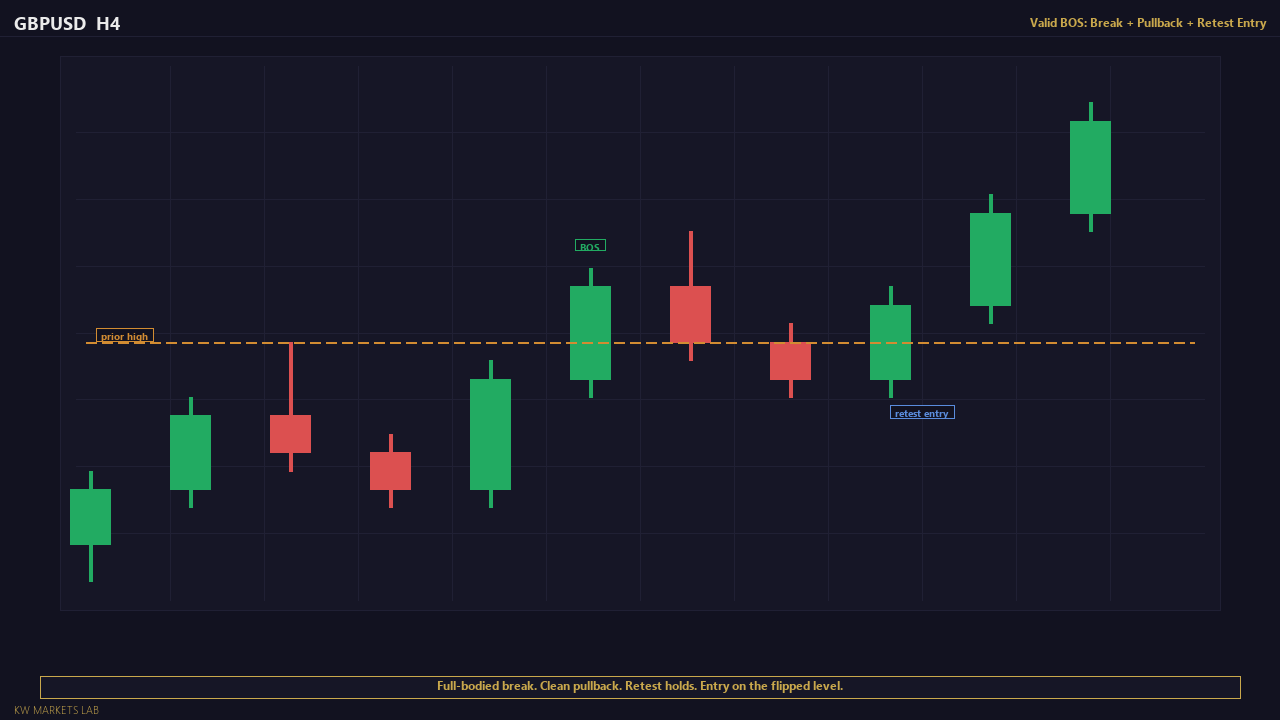
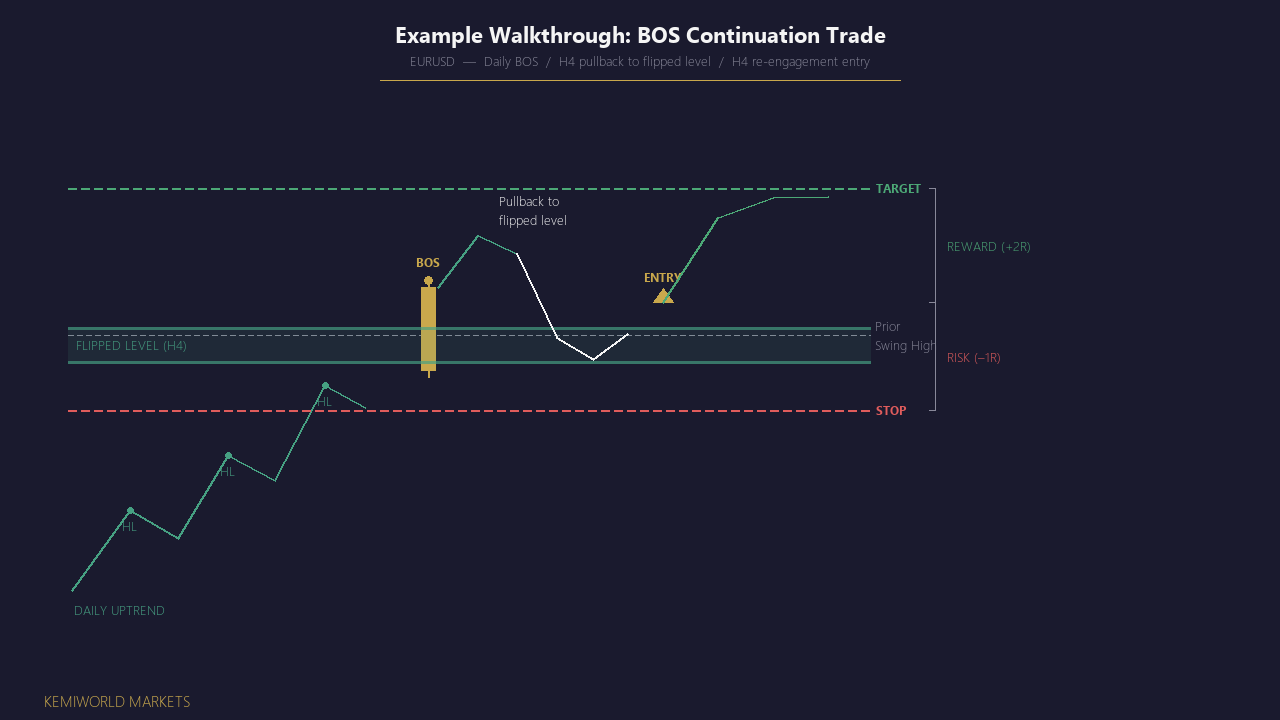
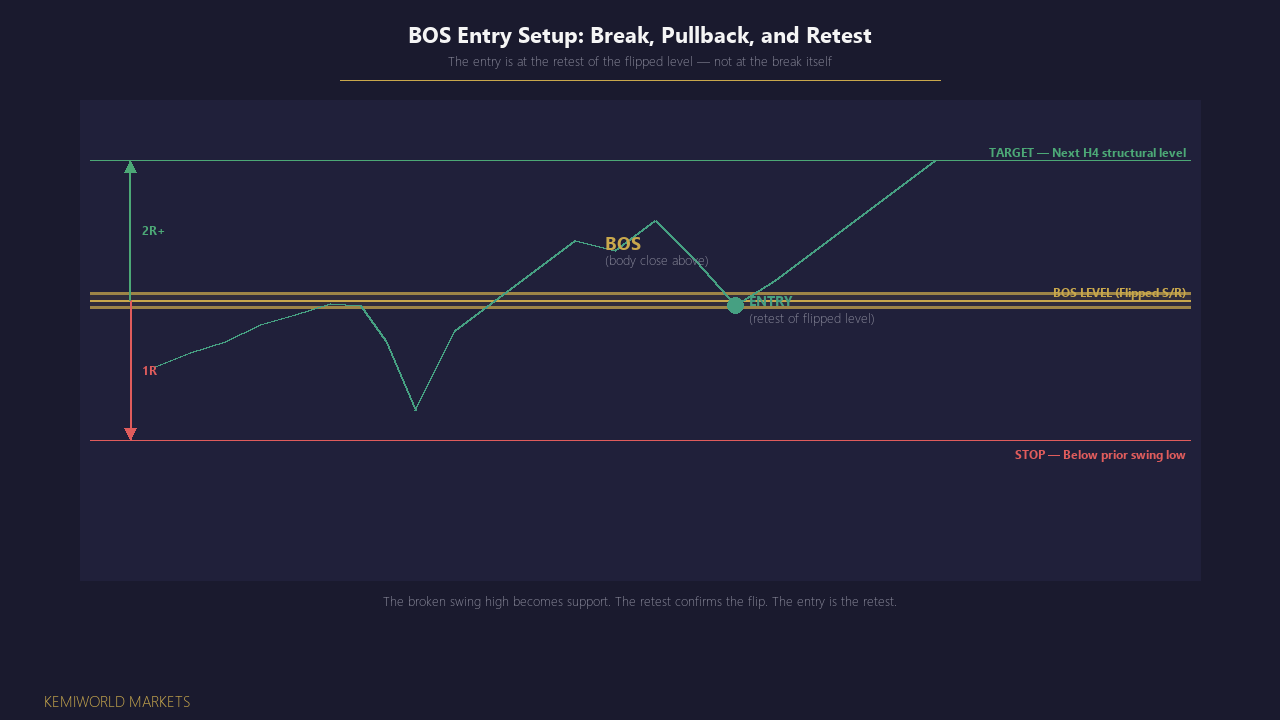
The Break of Structure (BOS) Continuation is a universal trend-following entry model that works across forex, metals, and indices. The core principle: when price breaks a significant swing point in a trending market, the broken level changes its structural role. Former resistance becomes support (bullish BOS), or former support becomes resistance (bearish BOS). The first pullback to that flipped level -- if it holds -- is the entry.
The Structural Logic
Every trend is a sequence of swing highs and swing lows. In an uptrend (HH/HL), each new higher high breaks the prior swing high. That broken level now sits below the current price as a potential support zone. Institutional participants who missed the initial break often place orders at this flipped level, creating demand that supports the pullback retest.
The BOS continuation model exploits this mechanics. You are not entering on the break itself (breakout trading). You are entering on the retest of the broken level (pullback trading). This distinction is critical because breakout entries carry significantly higher false-break risk.
Why Wait for the Pullback
Entering on the break itself means you are buying at the highest recent price, you cannot define a tight structural stop, and false breaks will produce full-size losses immediately. Entering on the pullback means you are buying at a level where demand has been demonstrated, your stop is structurally meaningful, and false breaks that do not reach the retest level are filtered out automatically.
Framework Requirements
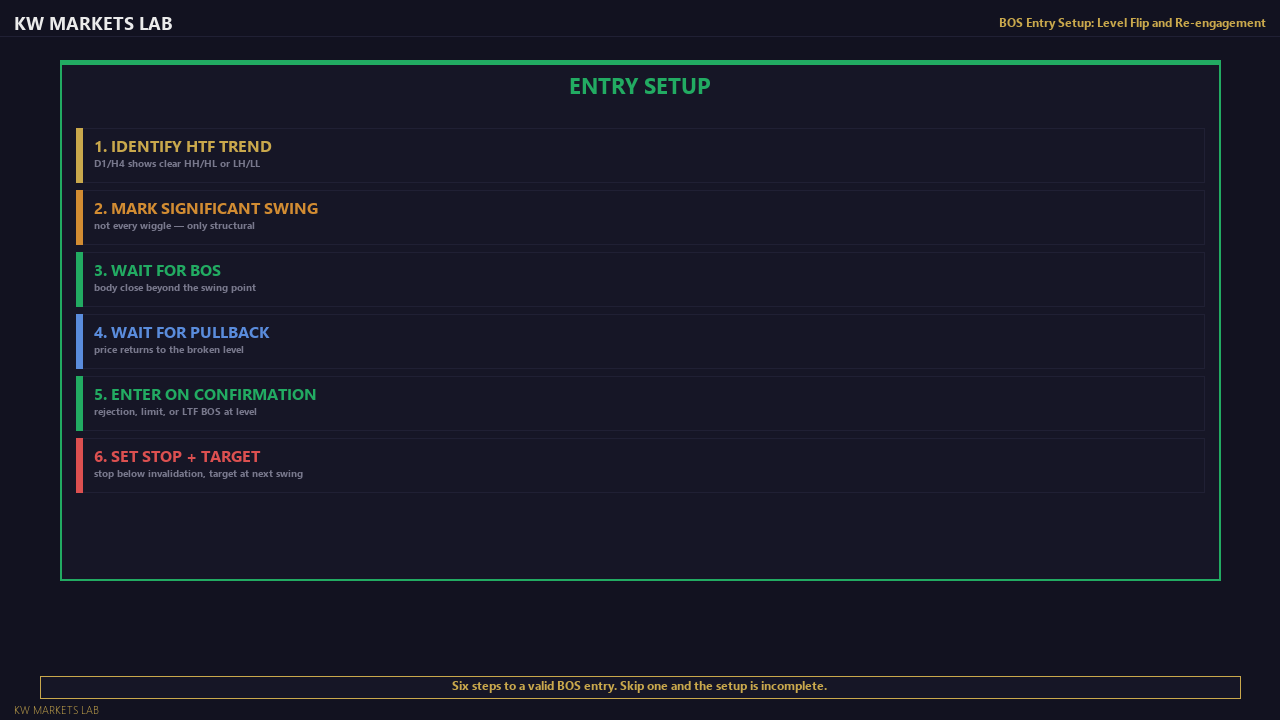
Three conditions must align:
1. Higher-timeframe bias -- Daily or H4 must show clear trending structure
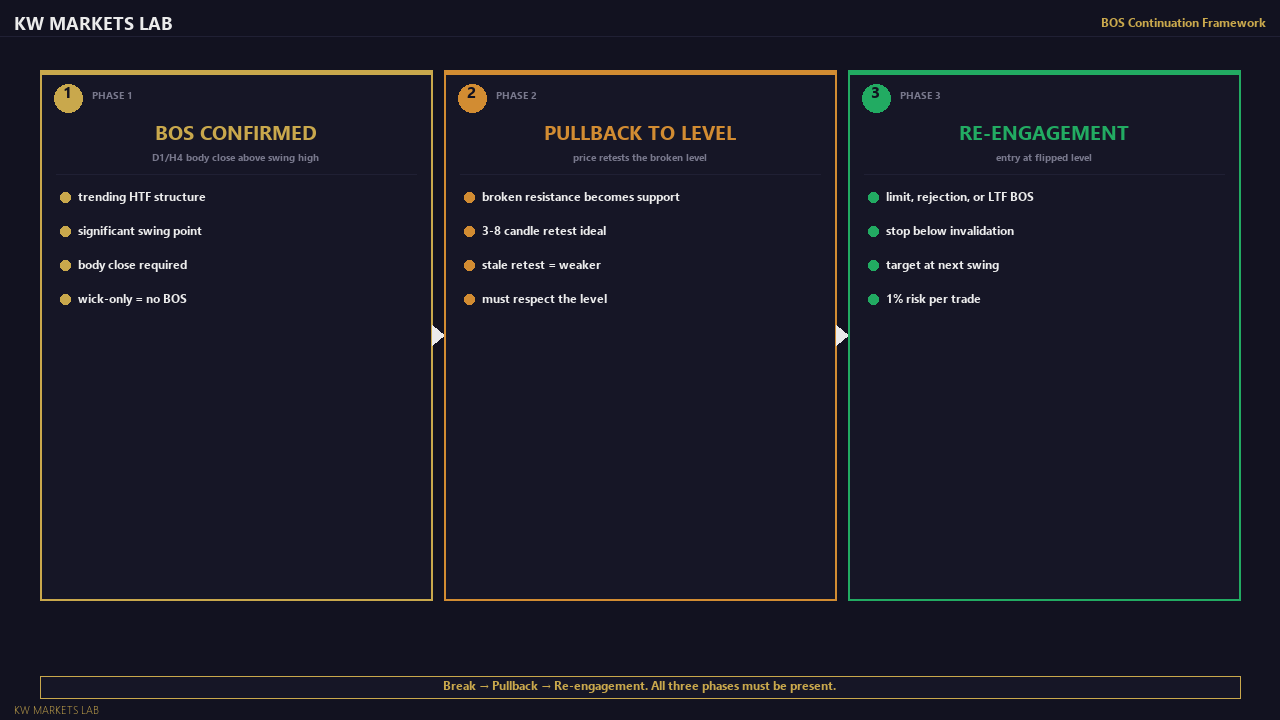
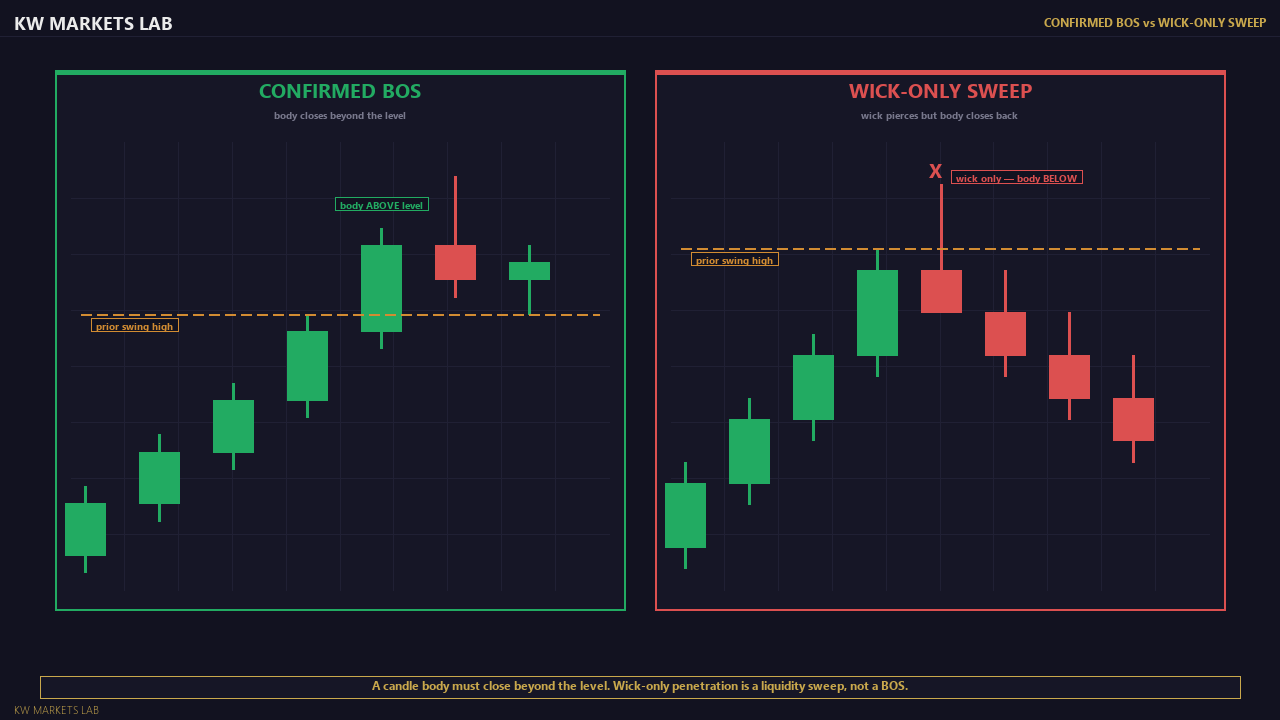
2. Confirmed BOS -- A candle body must close beyond the swing point (not wick-only)
3. Pullback retest -- Price must return to the broken level and show signs of holding
Cross-Market Application
This model works on any liquid market with clean structural behaviour:
- Forex: EURUSD, GBPUSD, USDJPY -- tightest stops, most frequent setups
- Gold (XAUUSD): Same logic, wider stops (80-150 pips), smaller lot sizes
- Indices (US30, NAS100): Strong trend phases produce clean BOS + retest patterns
The entry logic is identical across markets. What changes: stop buffer depth, position sizing (pip value), and session timing preferences.
Market Conditions Required
Before looking for a BOS continuation setup on any instrument:
- The higher timeframe (Daily or H4) must show at least two confirmed swing pairs in the trend direction. One HH is not a trend — it is one data point. Two HH/HL pairs establish the sequence.
- Price must not be approaching a major HTF supply/demand zone in the direction of the trade. A bullish BOS that runs into Weekly resistance within 30 pips of the entry has no room to reach target.
- The instrument must have normal volatility. If today's range has already exceeded 1.5x the average Daily ATR, the market is in an outlier state. BOS retests in outlier conditions have erratic follow-through.
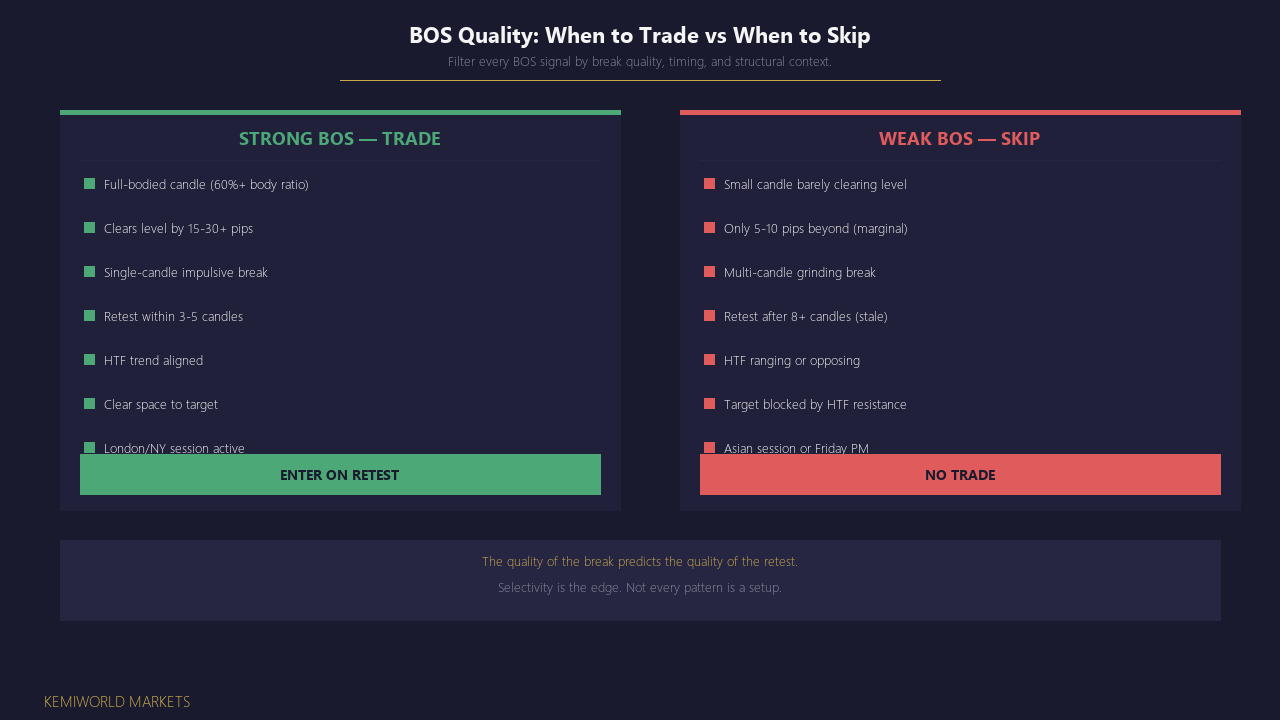
What Makes This Setup Weak
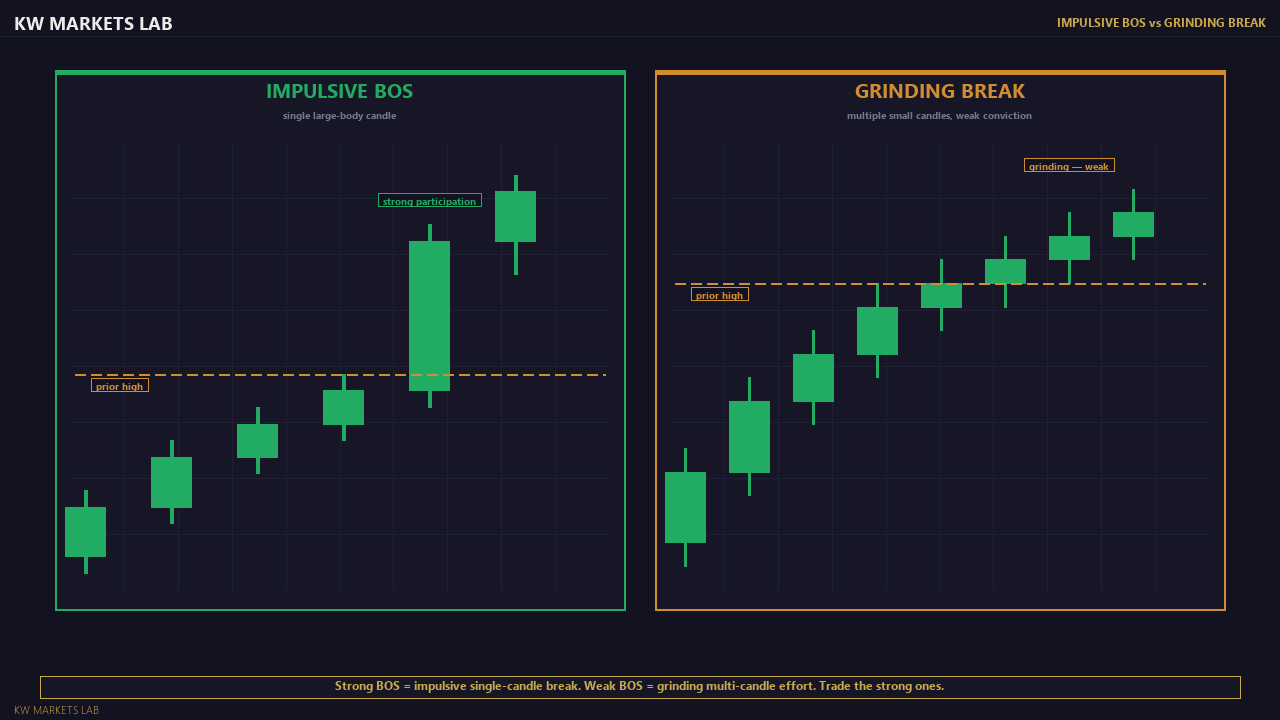
- The breaking candle is small-bodied (under 60% body ratio) and required multiple candles to clear the level. Strong BOS = one impulsive candle. Weak BOS = grinding.
- The swing point that was broken was minor — formed recently, tested only once, not clearly visible on H4. More-tested, more-respected levels produce more reliable flips.
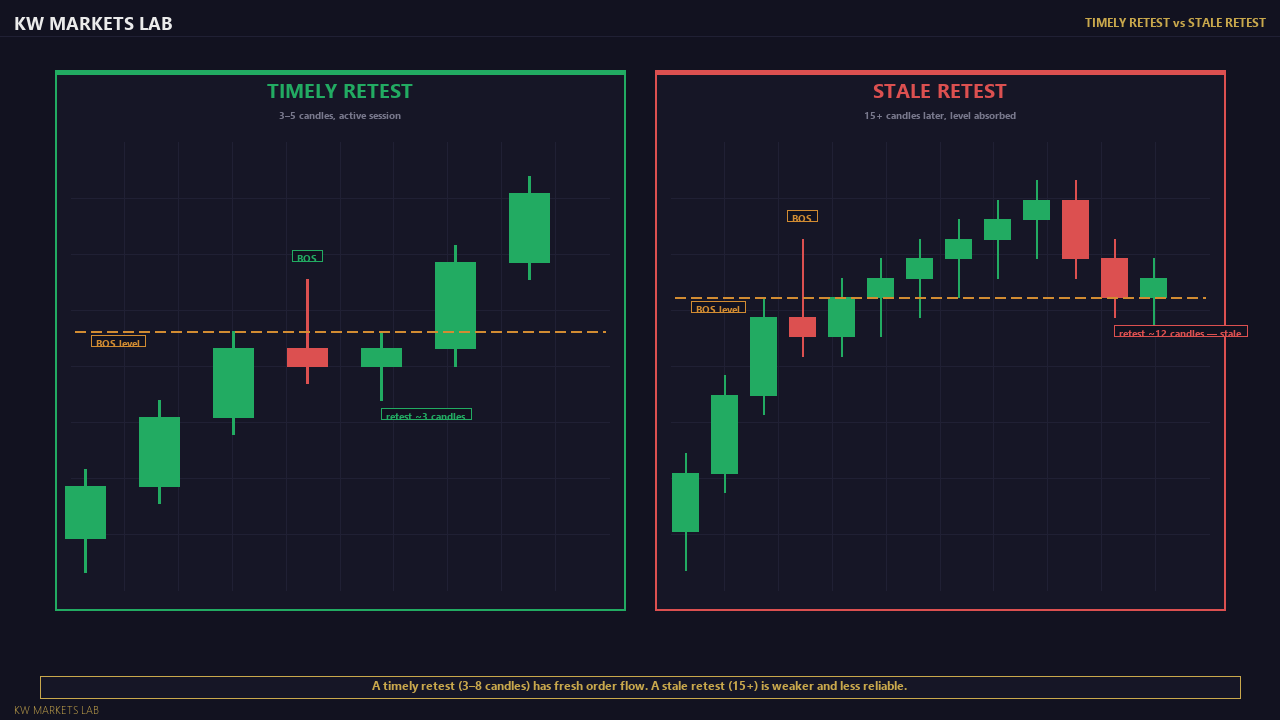
- The retest takes too long (8+ candles on H4). By then the level is stale — order density has been absorbed.
- The retest occurs during off-hours for the instrument (Asian session for forex, pre-market for indices).
Common Beginner Mistake
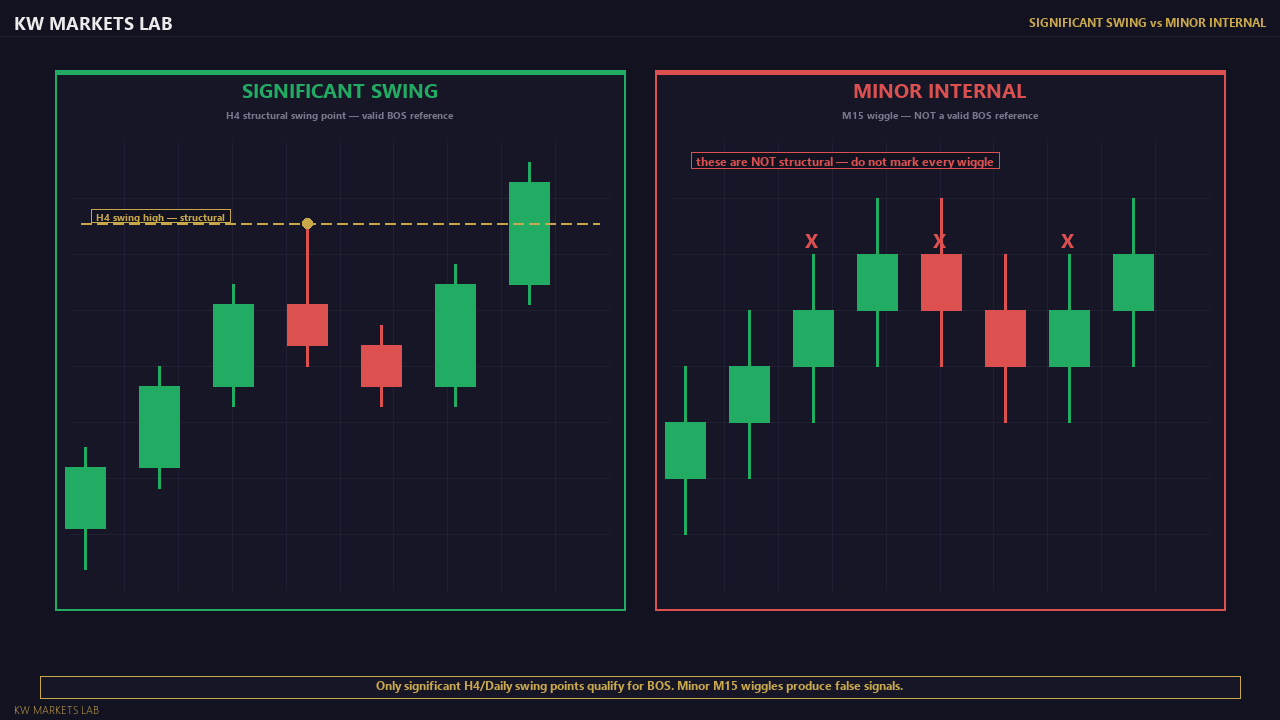
Treating every minor swing break on M15 as a BOS. Beginners mark every wiggle, producing dozens of false signals. The fix: only mark swings clearly visible on H4. If you have to zoom in to see the swing, it is an internal move — not a structural break.
The second mistake: entering on the break itself instead of waiting for the retest. The break is the signal. The retest is the entry. Entering on the break means buying at the session high.
What Experienced Traders Notice
- Break speed: a fast, impulsive break (30+ pips beyond in 1-2 candles) signals strong participation. A slow grind signals weak conviction.
- Whether the break was clean or contested. Multiple wicks at the level before the body close = contested = weaker retest.
- Position in the trend. First BOS after consolidation = highest probability. Third or fourth consecutive BOS = extended, higher reversal risk.
- Structural space to target. If the next resistance is 20 pips above entry, the R:R is insufficient regardless of how clean the BOS was.
When to Skip This Trade
- Higher timeframe is ranging or ambiguous
- BOS candle was wick-heavy and indecisive (liquidity sweep, not structural break)
- Retest level is within 30 minutes of a high-impact news event
- You already hold a position on a correlated instrument in the same direction
- R:R to the next structural obstacle is below 1.5:1
Entry Conditions
All conditions must be confirmed before entry.
1. Trending Structure on the Higher Timeframe
The Daily or H4 chart must show a clear swing sequence: HH/HL for bullish or LH/LL for bearish. At least two consecutive swing pairs should be visible. If the structure is ranging or ambiguous, this strategy does not apply.
2. Significant Swing Point Identified
The swing point being broken must be structurally meaningful -- not a minor internal wiggle. A significant swing has been respected at least once by prior price action and is clearly visible on the chart without zooming in.
3. Confirmed Break: Body Close Beyond the Level
A candle body must close cleanly beyond the swing point. Wick-only penetrations are potential liquidity sweeps -- not confirmed structural breaks. The breaking candle should be full-bodied (60%+ body-to-range ratio). Small, grinding candles that barely clear the level are low-quality breaks.
4. Pullback to the Broken Level
After the break, price must retrace toward the broken level. The ideal retest touches or comes within 10-20 pips of the broken level (forex) or 50-100 pips (gold), shows rejection (long wick, engulfing candle, or lower-timeframe BOS), and occurs within 3-8 candles of the break. Stale retests degrade.
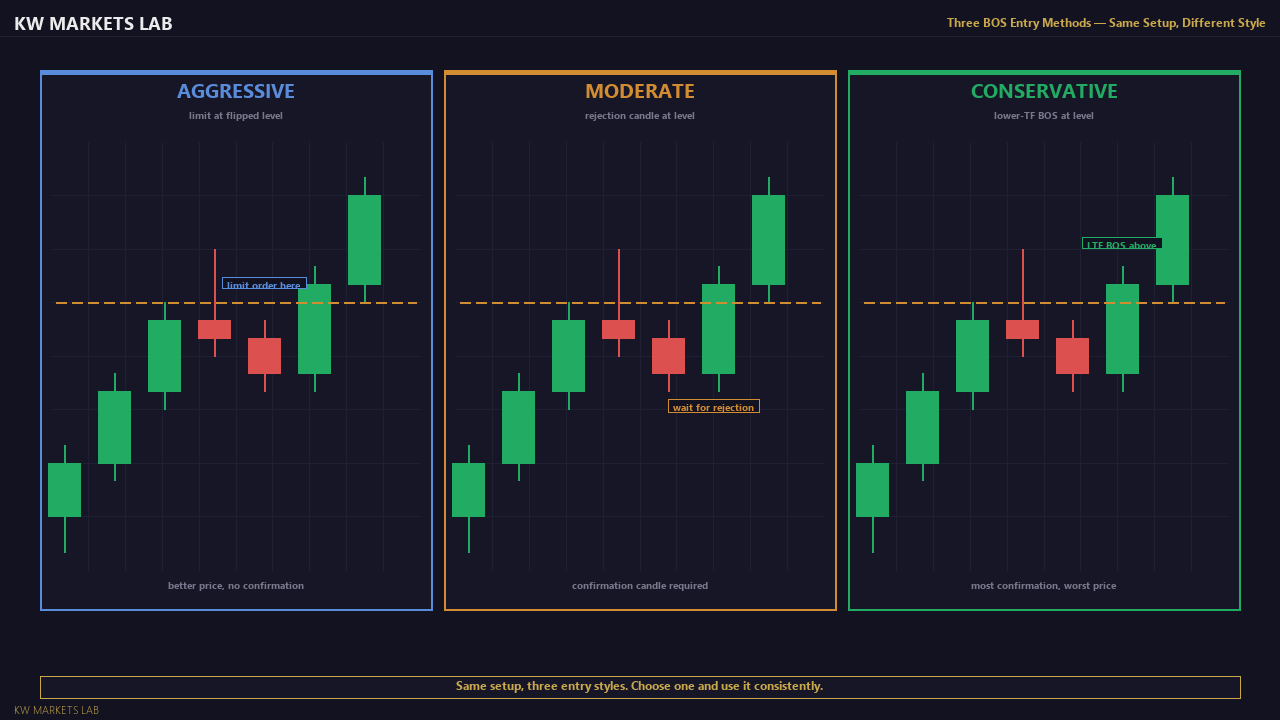
5. Entry Confirmation
Three methods (choose one consistently):
- Limit order at the broken level (aggressive -- no confirmation required)
- Rejection candle at the level on the entry timeframe (moderate)
- Lower-timeframe BOS at the level in the trend direction (conservative)
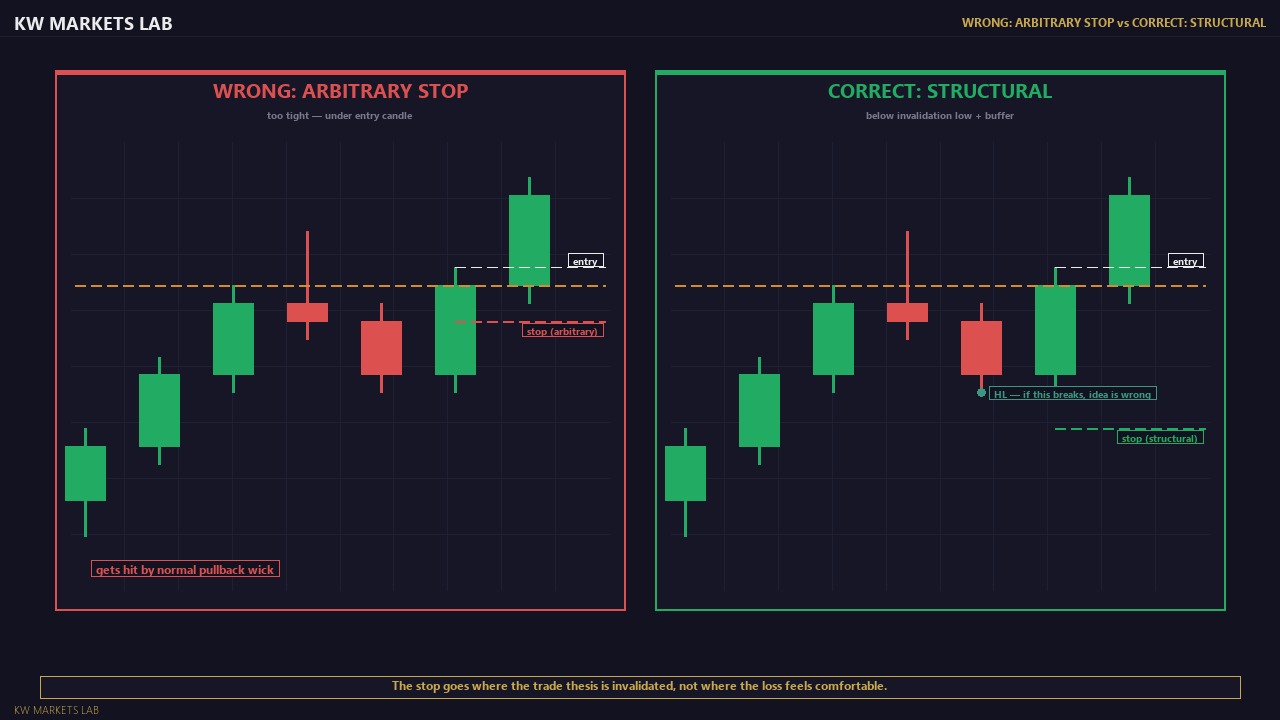
6. Stop Placement
Stop must be placed beyond the structural invalidation point. Forex: below the prior swing low (bullish), typically 20-40 pips. Gold: below the prior swing low + wick buffer, typically 80-150 pips. Indices: below the zone boundary + buffer, typically 50-100 pips.
7. Risk Calculation
1% of account balance per trade. Lot size = Risk amount / (Stop pips x pip value per lot). Recalculate for every trade. Never carry forward a previous lot size.
8. Target
The next significant structural level in the trend direction. Minimum R:R: 1.5:1. If the target does not provide sufficient R:R due to a nearby structural obstacle, skip the trade.
Failed Setup Example
USDJPY Daily bullish. H4 swing high at 149.50. A candle closes at 149.55 — barely 5 pips above. The candle body is 40% of the total range. Price pulls back to 149.48 during Asian session, 10 candles after the break.
Why this fails: the break was marginal (5 pips), the candle was weak (40% body), the retest was stale (10 candles later), and it arrived during Asian hours. A strong BOS clears the level by 15-30+ pips with a full-bodied candle and retests within 3-5 candles during London/NY.
Invalidation & Risk Rules
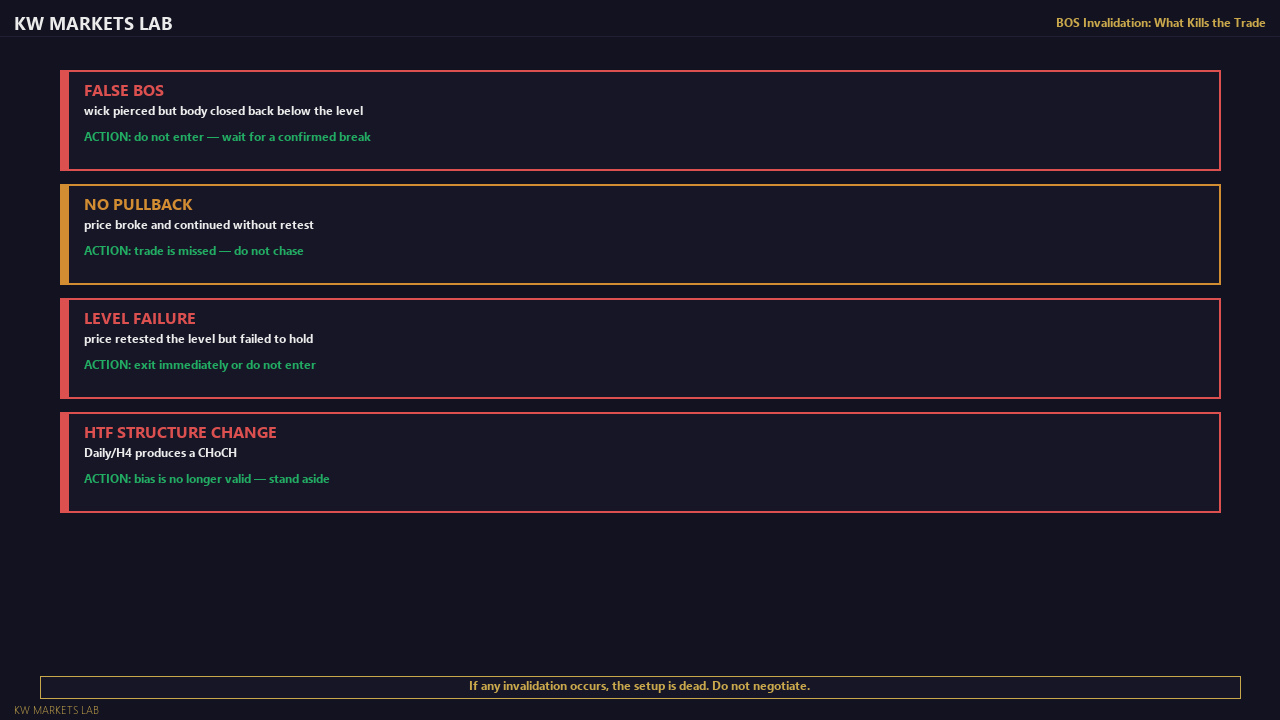
When the BOS setup is invalidated -- do not enter or close immediately.
1. False Break: Body Close Back Through the Level
If a candle body closes back through the broken level (below it for bullish BOS, above it for bearish BOS), the break is false. The swing point was not genuinely broken -- it was swept for liquidity. Cancel the setup.
2. No Pullback Occurs
If price breaks the swing point and continues directly without pulling back, the trade is missed. Do not chase. Do not enter at an arbitrary level hoping for a late retest. Wait for the next valid setup.
3. Higher-Timeframe Structure Changes
If the trending structure on the Daily or H4 produces a CHoCH (Change of Character) before the retest occurs, the directional bias is invalid. Cancel the pending order.
4. Retest Fails to Hold
If price retests the broken level and then closes back through it (the flipped level did not hold), the setup has failed. The structural flip was not confirmed by demand/supply. Exit immediately if already entered.
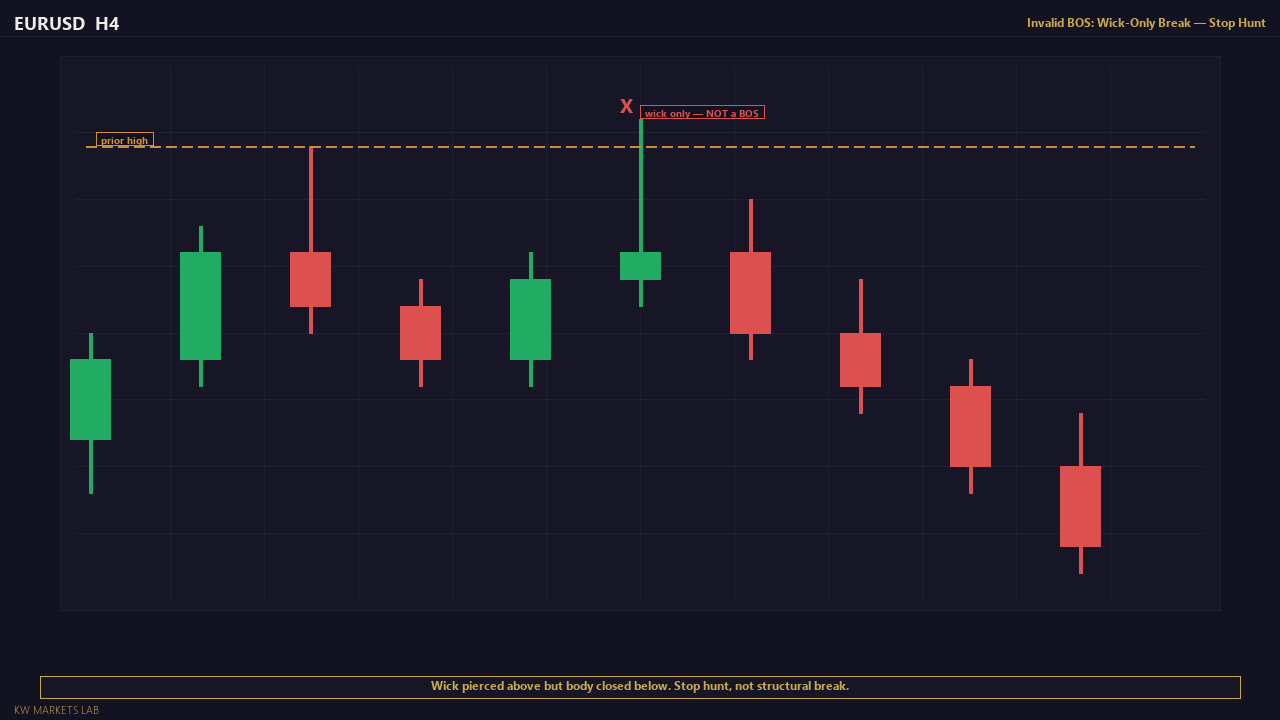
5. Wick-Only BOS
If the swing point was only penetrated by a wick (no body close beyond), this is not a confirmed BOS. It is likely a liquidity sweep. The structural read does not update on wick-only moves.
6. News Event at Retest
If the retest coincides with a high-impact news release (within 30 minutes), the price behaviour is news-driven, not structurally driven. Skip the trade.
The Stop-Hunt Trap
Price pushes through the swing level by 8 pips. You enter the "retest." Price then reverses through the level entirely. This happens because the initial break was a liquidity sweep — wicks above the level to trigger buy stops — not a genuine structural change. A genuine BOS closes 15+ pips beyond on forex with a full-bodied candle. If the break barely cleared the level, it was more likely a sweep than a break.
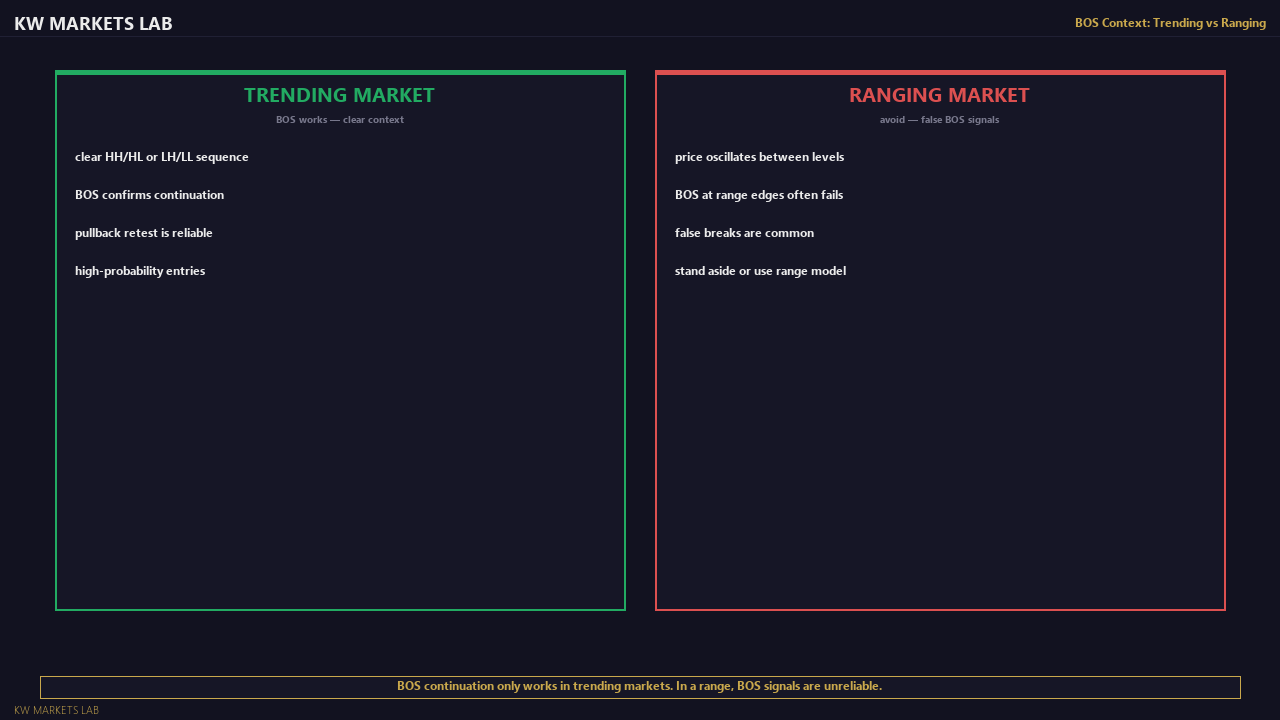
Where It Works
- Trending major forex pairs (EURUSD, GBPUSD, USDJPY) with clean D1/H4 HH/HL or LH/LL structure.
- Gold (XAUUSD) during established daily trends -- wider stops but the BOS+retest logic is identical.
- Trending indices (US30, NAS100) during clear directional phases -- especially post-earnings settling periods.
- Post-consolidation breakouts -- the first BOS after a multi-day range break often produces the cleanest retest.
- London and New York sessions -- the highest-volume windows produce the most reliable retests.
- After decisive, full-bodied BOS candles -- strong breaks produce strong retests. Weak, grinding breaks produce weak retests.
Where It Fails
- Choppy or ranging conditions -- false breaks are frequent. The strategy requires trending structure.
- News-driven breaks -- a BOS caused by a single news candle may not produce a meaningful retest.
- Small or recent swing levels -- more established, more-tested levels produce more reliable flipped zones.
- Late-trend BOS -- the 3rd or 4th consecutive BOS in one direction has lower probability as reversal risk increases.
- Low-liquidity sessions -- Asian session retests on forex have lower follow-through.
- Correlated pairs -- taking the same BOS setup on EURUSD and GBPUSD doubles USD exposure. Choose the cleaner setup.
Known Limitations
-
BOS identification requires judgement. "Significant" swing levels are not objectively defined. Two traders may mark different swing points on the same chart. Consistency matters more than perfection.
-
The pullback may not occur. Strong trends can continue without retesting the broken level. This means missed trades -- not failed analysis. Accept that some setups will be missed.
-
False BOS signals are common during transitional market phases (trend losing momentum, approaching HTF supply/demand). The higher-timeframe bias filter helps but does not eliminate this risk.
-
Win rate is moderate (40-55%). Profitability depends on maintaining positive R:R (1.5:1 minimum). Cutting winners early destroys the edge.
-
Gold and indices require significantly wider stops than forex. This means smaller lot sizes and slower account growth -- but the same 1% risk per trade.
-
The strategy has a natural frequency limit: 2-4 setups per week across a watchlist of 5-8 instruments. It is not a high-frequency approach.
Visual Examples
Evidence & References
Murphy’s book is a core reference for chart-driven trend identification, support/resistance, continuation logic, and general technical-analysis structure. It is a legitimate foundational reference for the BOS continuation framework.
Technical Analysis of the Financial Markets
Dow Theory is a classical basis for reading directional structure and trend progression. It supports the idea that trend continuation should be judged by structural behavior rather than isolated candles
Investopedia
Research Notes
Grounded in documented support/resistance role reversal principles.
The BOS/retest methodology is one of the most widely documented concepts in technical analysis. The principle that broken support becomes resistance (and vice versa) appears in virtually every major technical analysis reference.
References:
- Brooks, A. (2012). Trading Price Action Trends. Wiley. Documents trend continuation via breakout pullbacks across multiple asset classes.
- Murphy, J. (1999). Technical Analysis of the Financial Markets. NYIF. Foundational treatment of support/resistance role reversal.
- Schwager, J. (2012). Technical Analysis. Wiley. Swing analysis and structural break patterns.
- Bulkowski, T. (2005). Encyclopedia of Chart Patterns. Wiley. Statistical analysis of pullback patterns after structural breaks.
Important: These references describe the pattern mechanics. They do not guarantee edge. Your own trade log -- minimum 30 setups -- is the only valid evidence of whether BOS continuation produces positive expectancy for your execution.
Learn the Full Framework
The concepts behind this strategy are covered in the Foundations course.
Start the Course →Full Documentation
Annotated examples, failure breakdowns, and complete evidence.
View VIP Access →