Overview
A three-timeframe framework for US30, NAS100, and SPX500 that identifies institutional supply and demand zones on the H4 chart and enters on H1 rejection signals within those zones, aligned with the Daily directional bias.
Before using this strategy:
When to Use This Strategy
- ✓US30 or NAS100 is in a clear Daily trend
- ✓A fresh (untested) demand or supply zone is identified on H4
- ✓Price is pulling back toward the zone during US session hours
- ✓The zone had a strong impulse departure (200+ pips on US30)
When NOT to Use It
- ✗The zone has already been tested once or twice (stale zone)
- ✗The index is ranging with no clear Daily trend
- ✗Major US economic data is due within 30 minutes
- ✗The zone is too wide (150+ pips) for a reasonable R:R
Framework Overview
Supply and demand zone rejection is a price action framework for entering trades at institutional order flow zones on indices. Unlike forex pairs, indices (US30, NAS100, SPX500) tend to produce sharp, deep pullbacks to supply and demand zones before continuing the prevailing trend.
What Supply and Demand Zones Are

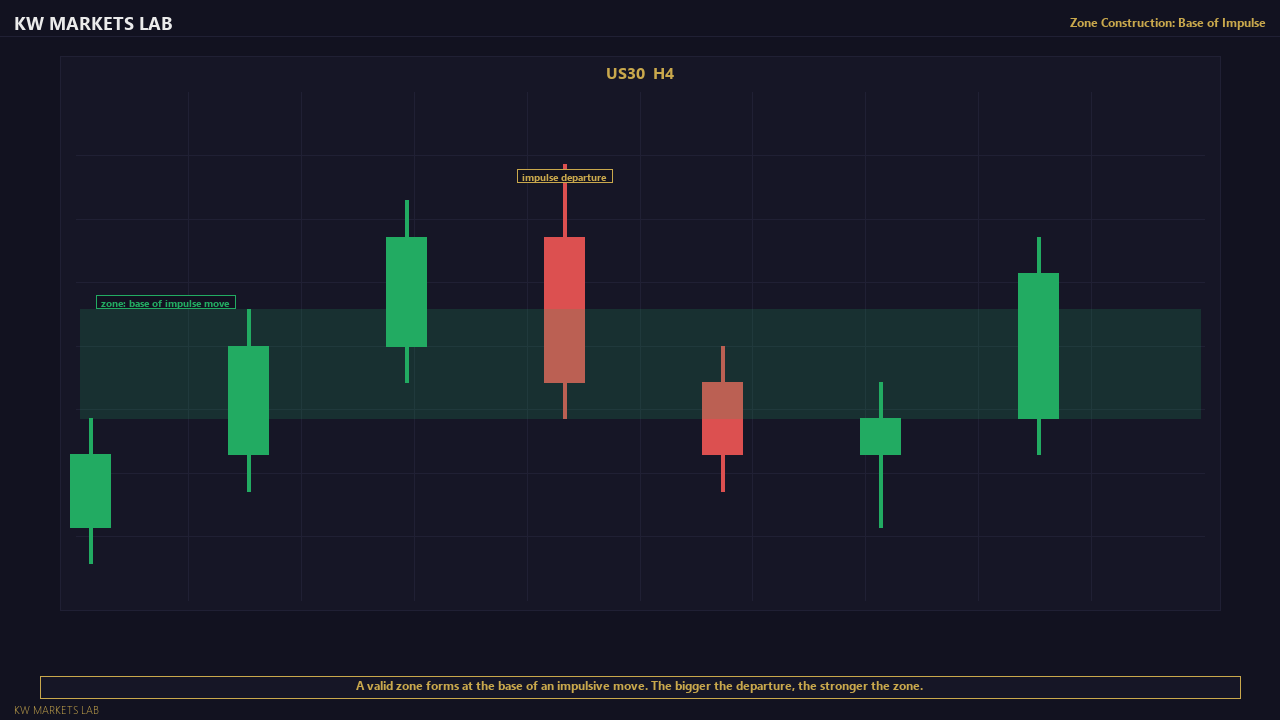
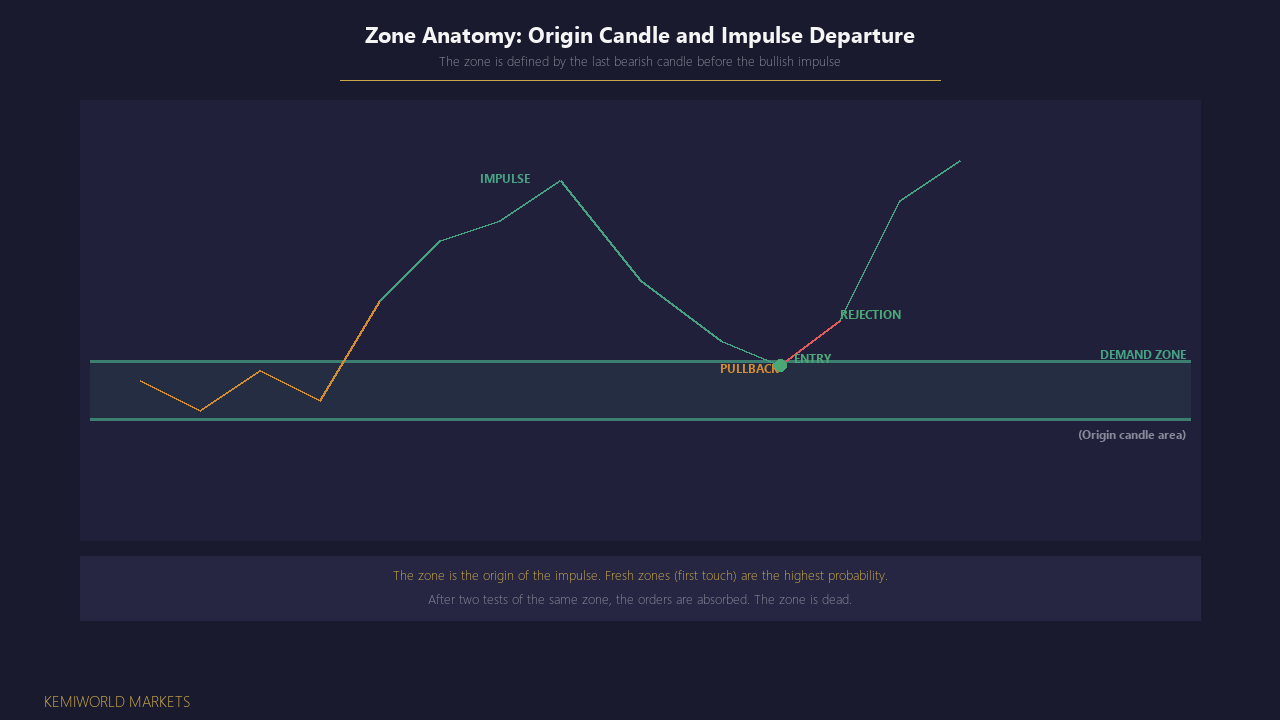
A demand zone is the area where a significant bullish move originated. The logic: institutional buyers placed large orders at this price, creating a rally. When price returns to this zone, remaining unfilled buy orders may produce another rally. The zone is defined by the last bearish candle before the impulse move (the "origin candle").
A supply zone is the mirror — the area where a significant bearish move originated. Unfilled sell orders at this level may produce another decline when price returns.
Why This Works on Indices
Indices have structural characteristics that make supply/demand zones particularly effective:
- Deep institutional participation creates clearly defined order zones
- Indices trend more frequently and more cleanly than many forex pairs
- Pullbacks to demand zones on indices are often sharp V-shaped reversals
- The ATR on US30 and NAS100 creates opportunities for clean 2:1+ R:R setups
Framework Structure
- Daily chart: confirm the prevailing trend direction (HH/HL bullish, LH/LL bearish)
- H4 chart: identify the most recent demand zone (for longs) or supply zone (for shorts) — the origin of the last significant impulse
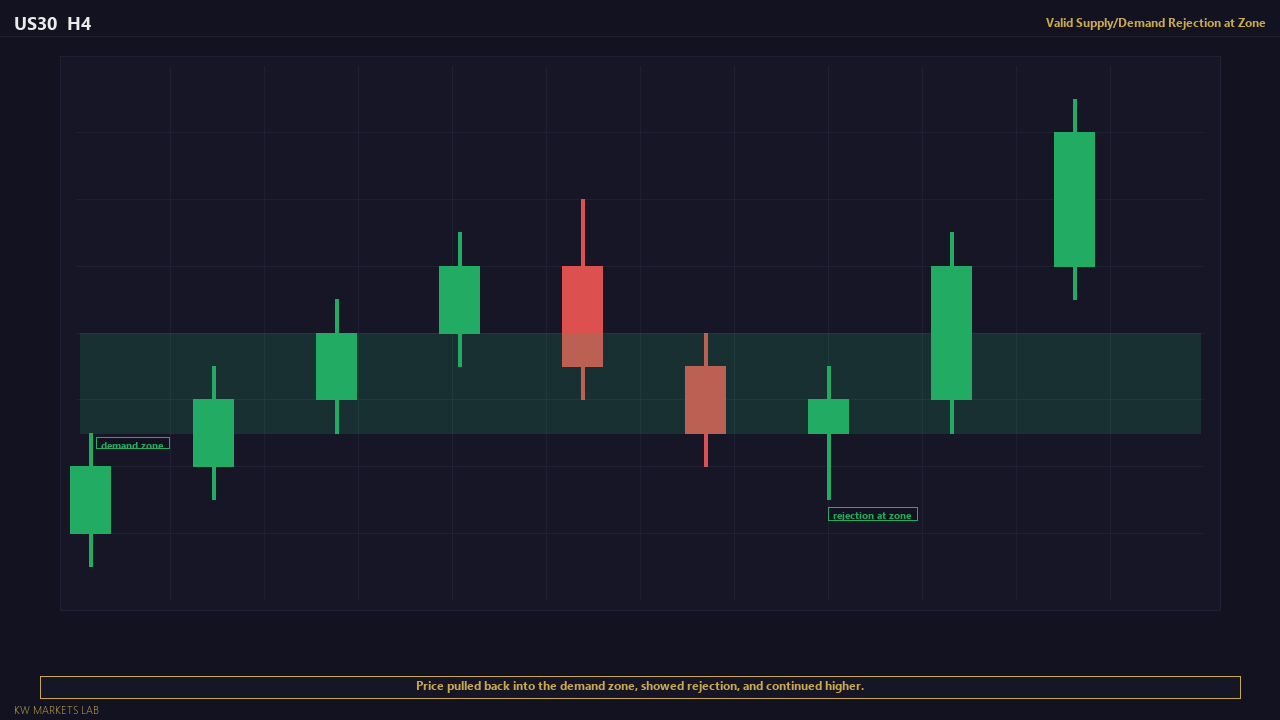
- H1 chart: wait for price to reach the zone, then look for rejection confirmation
- Entry on rejection with stop beyond the zone boundary
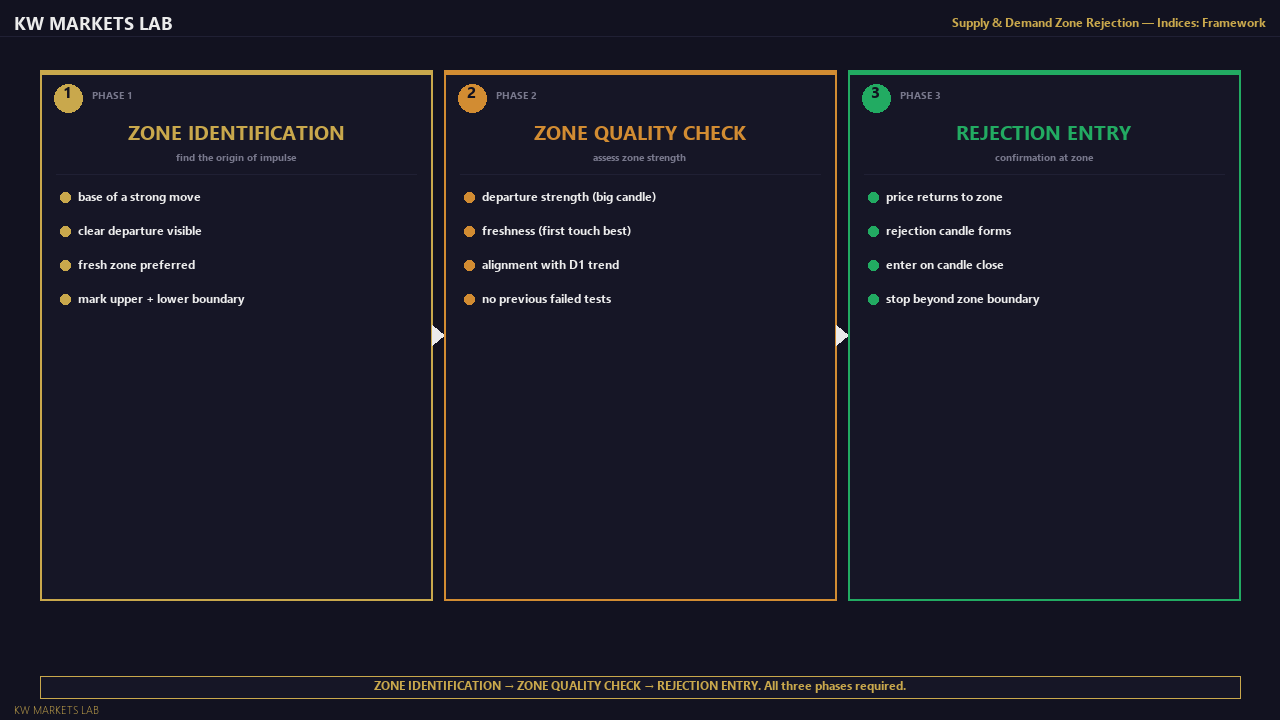
Zone Identification Rules
A valid demand zone must have:
- A strong impulse departure (the rally from the zone should be significant — at least 100+ pips on US30)
- A clean origin (the basing candles before the impulse should be tight, not wide and overlapping)
- The zone should not have been tested before (fresh zones are stronger than retested zones)
The same criteria apply in reverse for supply zones.
What This Strategy Is Not
This is not a support/resistance strategy. S/R levels are horizontal lines. Supply/demand zones are price areas defined by the origin candle of an impulse move. The distinction matters because the zone width determines the stop placement and the entry logic.
Market Conditions Required
This strategy requires specific index market conditions:
- The Daily chart must show a clear trend (HH/HL for longs, LH/LL for shorts). In ranging index conditions, zones break frequently and reversals are unreliable.
- The zone must be from the current trend — not a leftover zone from a prior trend direction. A demand zone that formed during the previous bearish phase and is now in a bullish reversal is less reliable than a fresh demand zone formed within the current bullish trend.
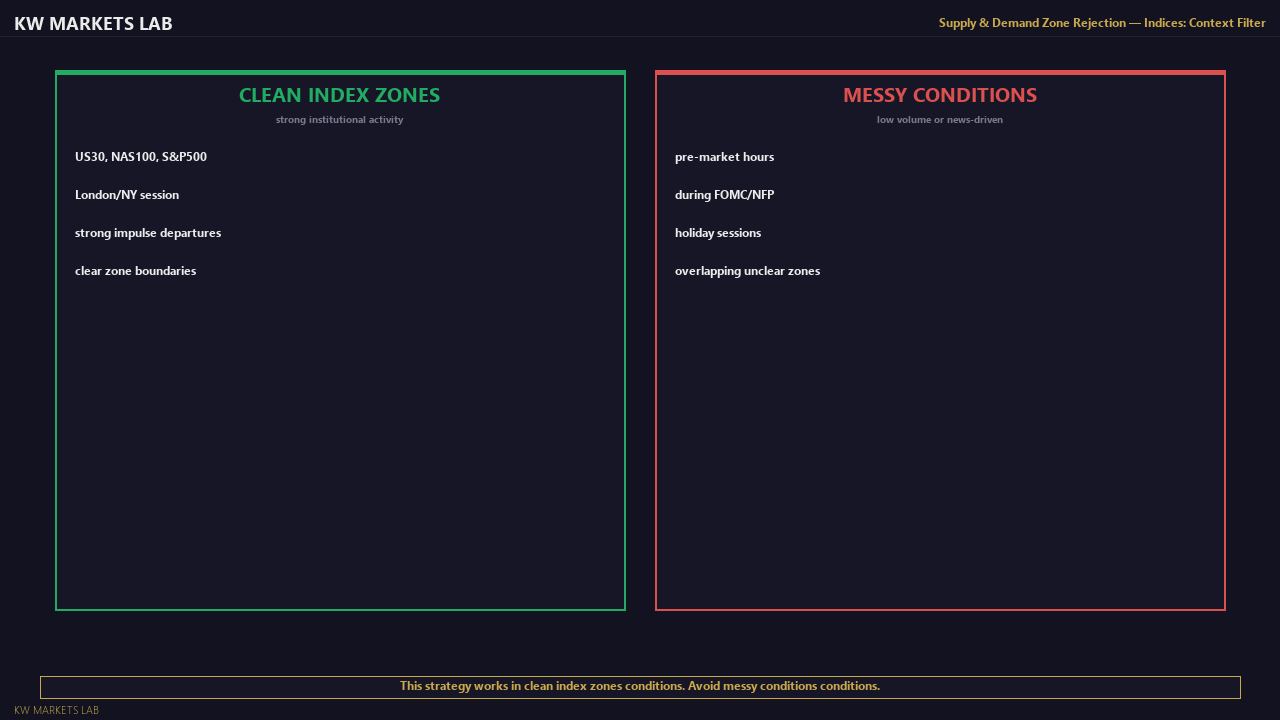
- US trading hours must be active (1330-2000 GMT). Index zone reactions during Asian or early European hours have significantly lower follow-through due to thin order book depth.
- Earnings season must not be creating abnormal volatility. During peak earnings weeks, individual stock moves can gap indices through zones without the normal rejection behaviour.
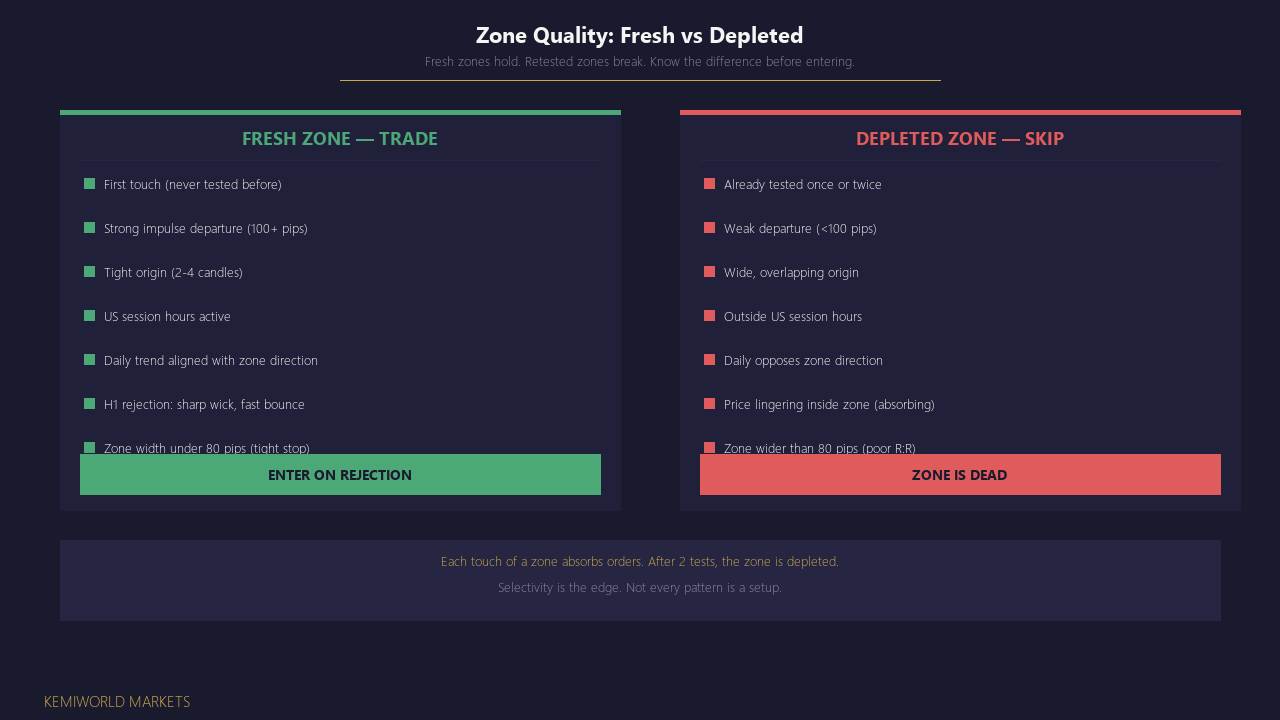
What Makes This Setup Weak
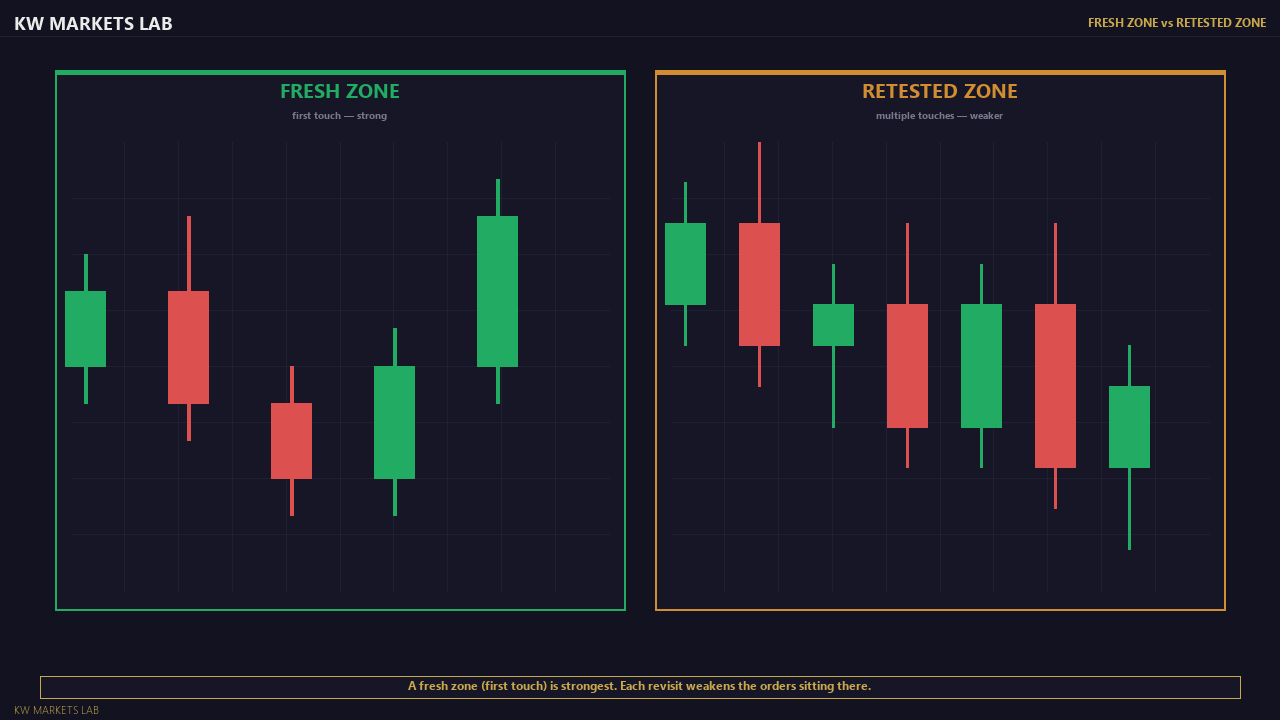
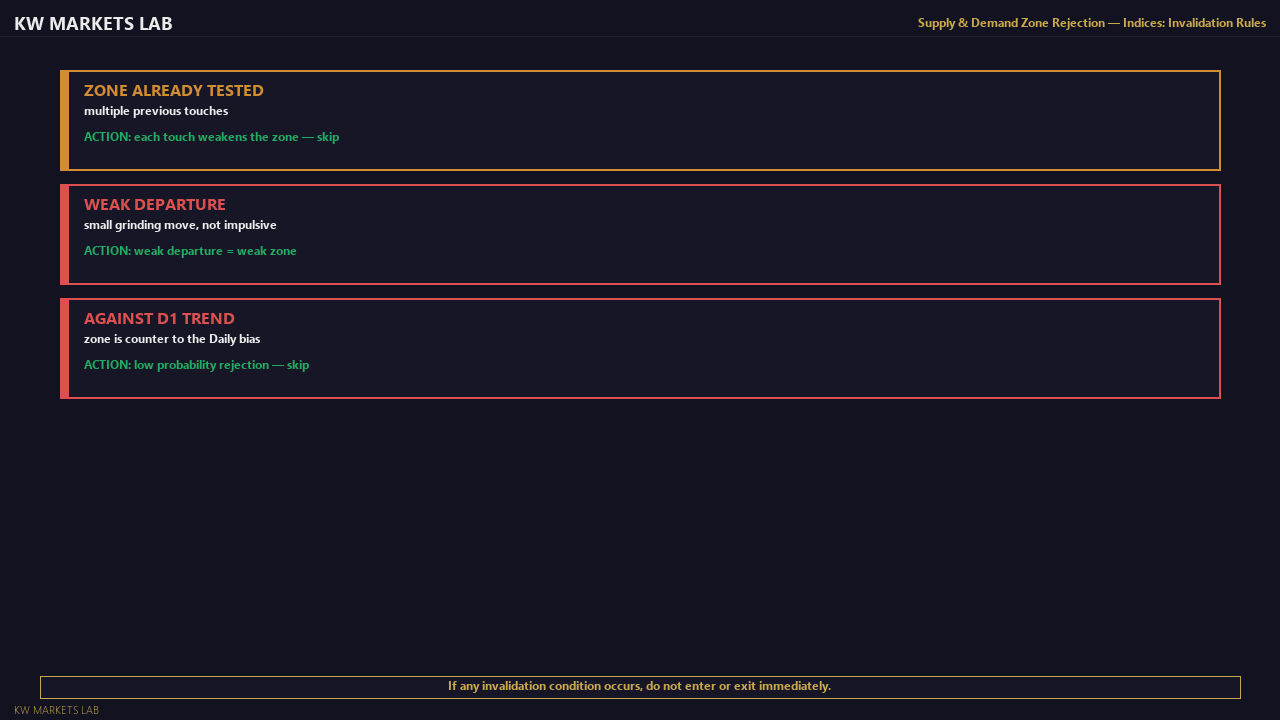
- The zone has been tested before. First-touch (fresh) zones hold with the highest probability. Each subsequent touch absorbs the institutional orders at that level. After 2 touches, the zone is depleted.
- The impulse departure from the zone was weak — less than 100 pips on US30 or 200 pips on NAS100. Weak departures signal weak institutional interest at that price level.
- The zone is wide (more than 80 pips on US30). Wide zones produce wide stops, poor R:R, and indicate an imprecise origin. Tight zones (20-40 pip origin) are higher quality.
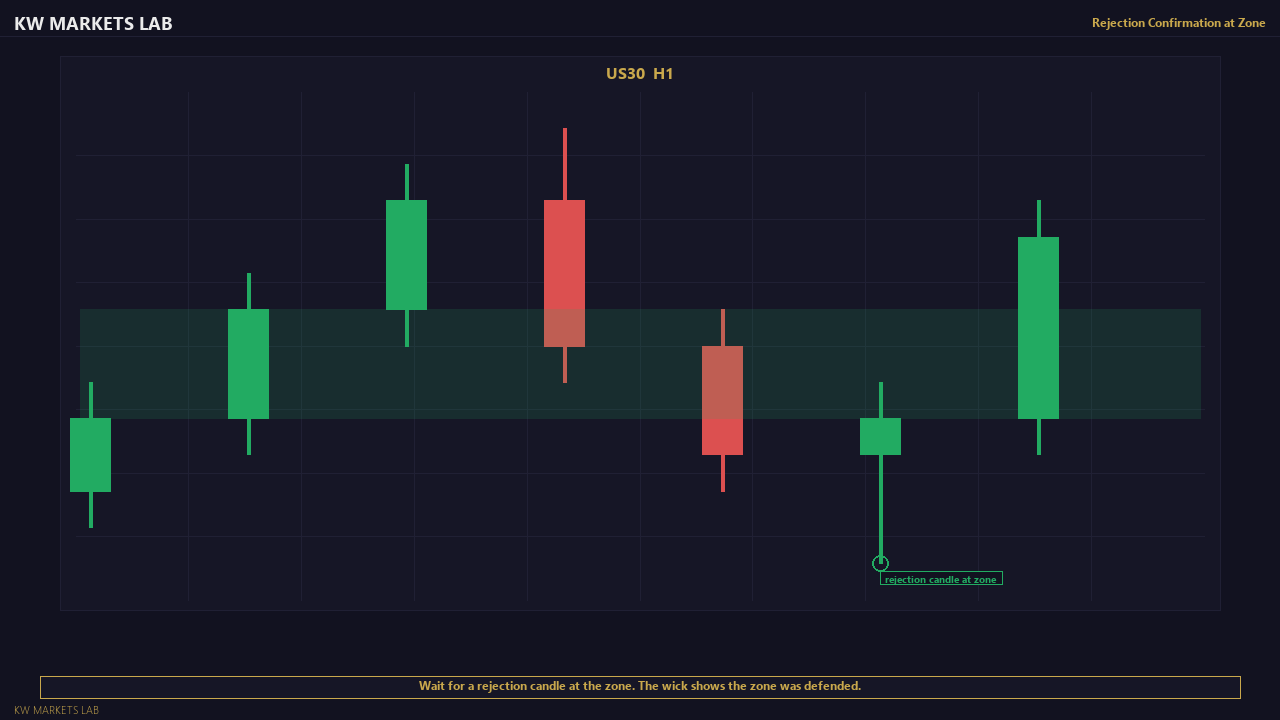
- The H1 rejection candle at the zone is small and indecisive. A strong rejection has a wick that penetrates the zone deeply and a body that closes sharply outside it.
Common Beginner Mistake
Drawing zones everywhere. Beginners mark every minor consolidation as a supply or demand zone, producing dozens of "zones" on a single chart. Most of these are noise — minor consolidations that do not represent significant institutional order flow.
The fix: only mark zones where the departure was impulsive and significant (100+ pips on US30). The origin should be tight (2-4 candles). If the origin area was wide and overlapping, it is not a clean zone — it is just a range.
What Experienced Traders Notice
- The speed of departure. An impulsive rally that moves 200+ pips in 2-3 candles away from a demand zone signals aggressive institutional buying. A slow, grinding departure suggests retail accumulation, not institutional demand.
- Whether the zone aligns with a session open. Demand zones that were created during the US session open carry more weight than zones formed during low-volume overnight trading.
- The structural context above/below. A demand zone with 300+ pips of clear space to the next supply zone has room to reach target. A demand zone with resistance 50 pips above has insufficient R:R.
- How price approaches the zone. A slow, corrective pullback into a demand zone is ideal — it shows that the selling is controlled and orderly. A fast, impulsive drop into the zone suggests panic selling that may overwhelm the demand.
When to Skip This Trade
- The zone has been tested once or twice already (stale)
- The zone is too wide for a reasonable R:R (80+ pips on US30)
- US session is not active
- Major economic data (NFP, CPI, FOMC, GDP) is due within 30 minutes
- The Daily trend opposes the zone direction
- An earnings report from a major index component is due today
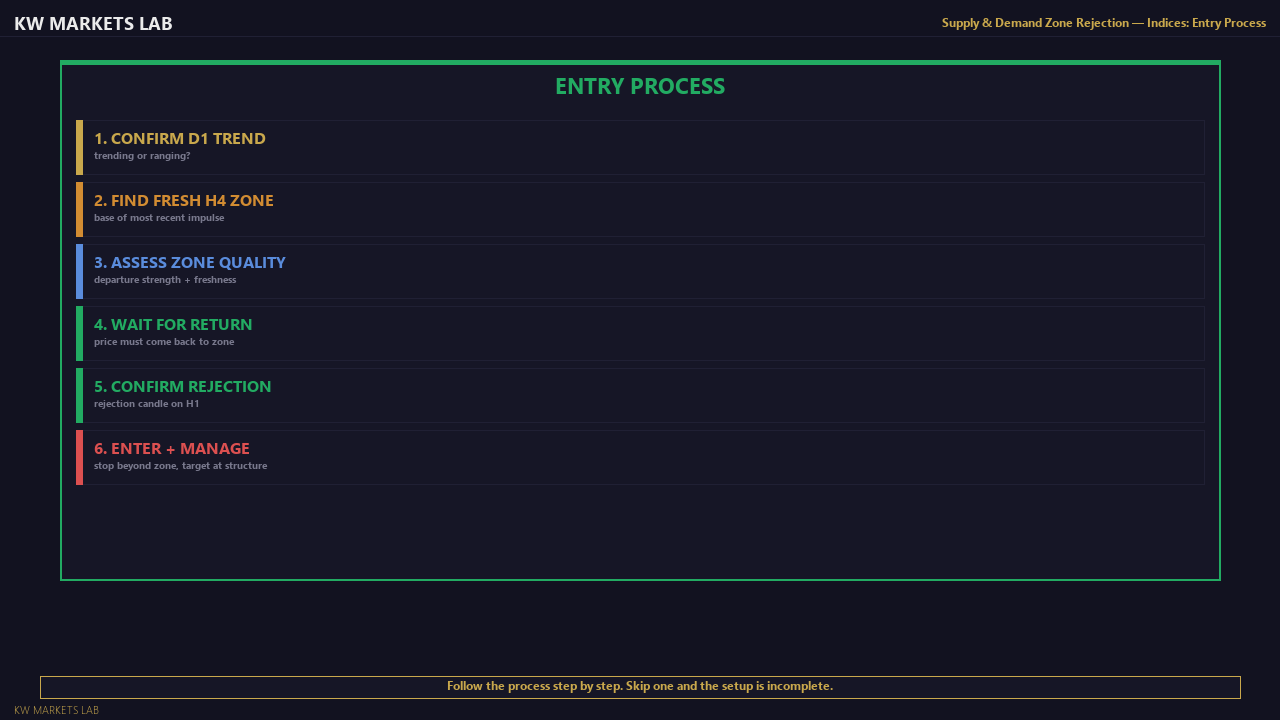
Entry Conditions
All conditions must be confirmed.
1. Daily Trend Confirmed
Daily chart must show clear HH/HL (bullish) or LH/LL (bearish) structure on the target index. If the Daily is ranging, this strategy does not apply.
2. Fresh Zone Identified on H4
The zone must be the origin of a significant impulse move that has NOT been retested. First-touch zones are the highest probability. A zone that has already been tested once is weaker. A zone tested twice is invalid.
3. Zone Quality Assessment
The impulse departure from the zone must be strong — at least 100 pips on US30, 200 pips on NAS100. Weak, grinding departures produce weak zones. The origin candles should be tight (2-4 candles maximum) — wide, overlapping bases produce wide, unreliable zones.
4. Price Returns to the Zone
Wait for price to pull back to the identified zone. Do not anticipate. If price does not reach the zone, there is no trade.
5. Rejection Confirmation on H1
At the zone, look for:
- Pin bar / rejection candle with wick into the zone and body closing outside
- H1 BOS in the direction of the Daily trend
- Engulfing candle at the zone boundary
6. Stop Placement
Stop must be placed beyond the far boundary of the demand/supply zone + a buffer (20-30 pips on indices). If the zone is too wide (150+ pips), the R:R may not justify the trade — skip.
7. Target
Primary target: the swing high (for longs) or swing low (for shorts) that defines the most recent impulse extreme. Minimum R:R: 2:1 on indices (the higher volatility justifies stricter requirements).
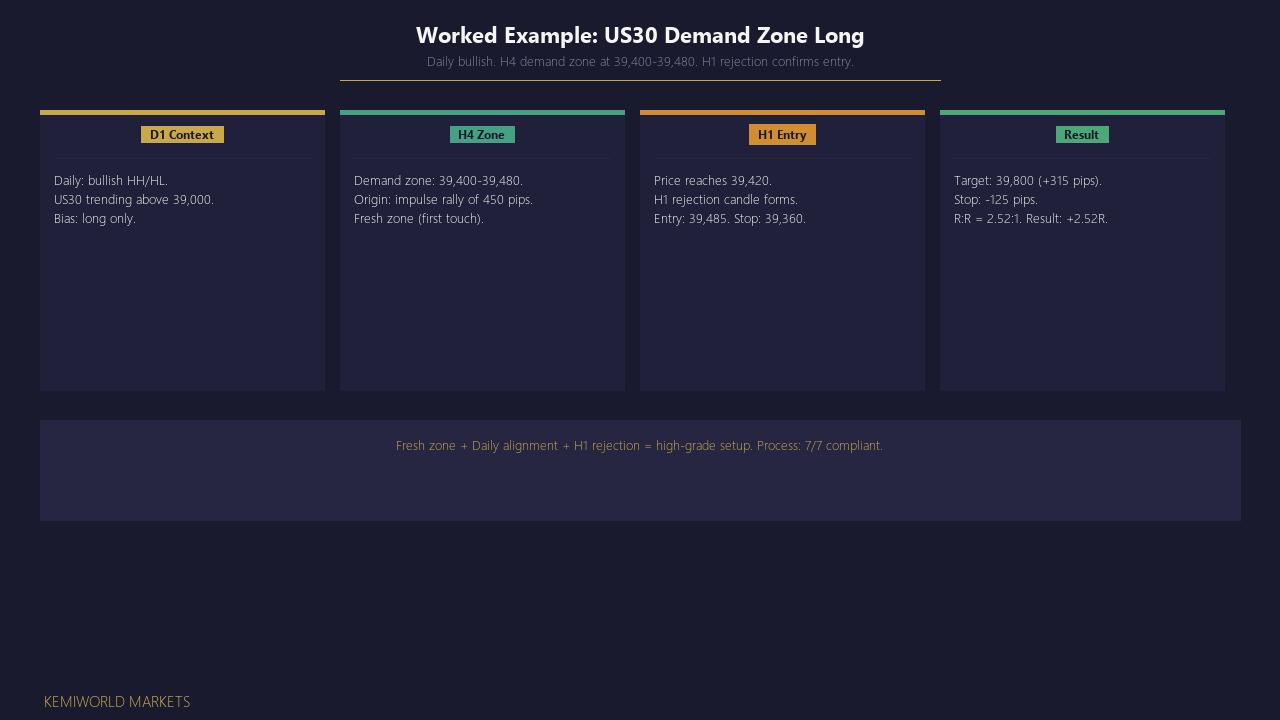
Failed Setup Example
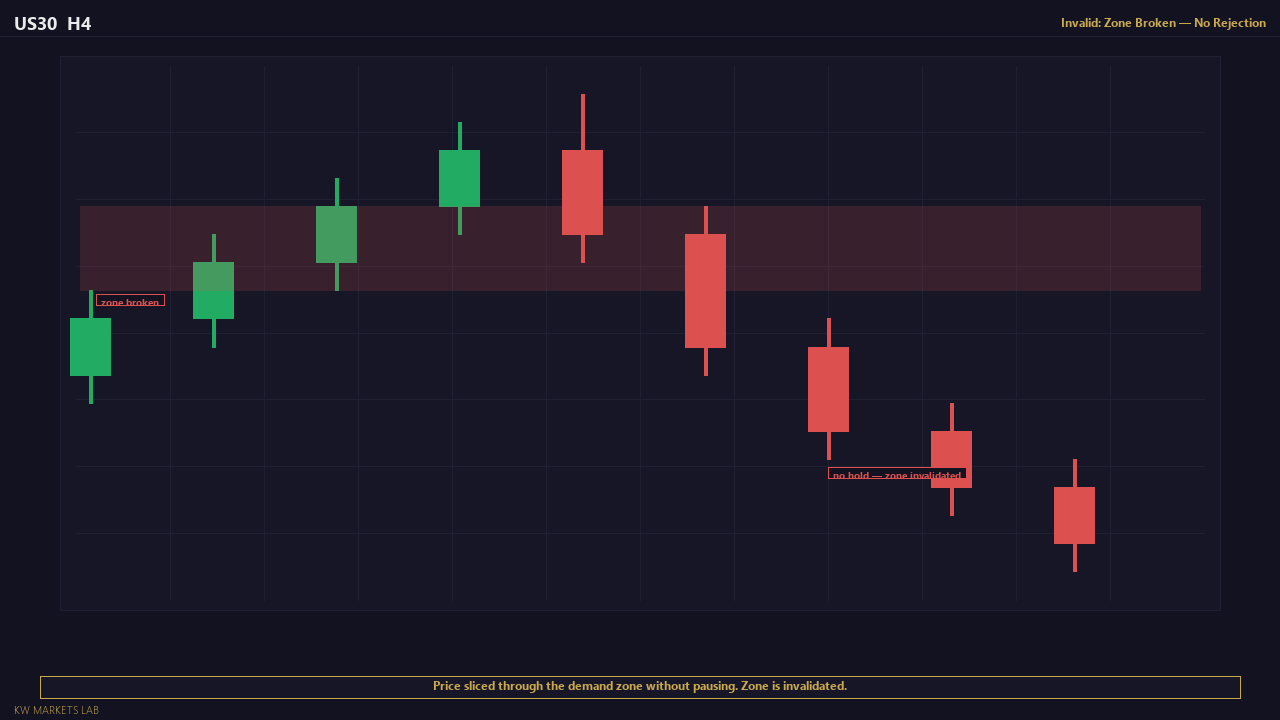
US30 Daily is bullish. An H4 demand zone sits at 39,100-39,200 (100 pip zone). Price has already visited this zone once and bounced 200 pips. Price returns to 39,120 a second time. A beginner enters long expecting another bounce.
Why this fails: the zone has already been tested once. The institutional buy orders that caused the first bounce are now partially or fully filled. The second test has significantly lower probability. Price enters the zone, spends 4 H1 candles grinding through it, and closes below 39,100. The zone is broken — the orders are absorbed. Only trade fresh zones.
Invalidation & Risk Rules
When the supply/demand zone setup is invalidated.
1. Zone Has Been Tested Before
A zone that has already been tested once is significantly weaker. After two tests, the zone is invalid — the orders have been absorbed. Only trade first-touch (fresh) zones.
2. Price Closes Through the Zone
If an H4 candle body closes through the zone (below demand, above supply), the zone has broken. The institutional orders at this level have been overwhelmed. Do not trade a broken zone.
3. Daily Trend Reverses
If the Daily structure produces a CHoCH before price reaches the zone, the directional context has changed. A demand zone in a bearish Daily environment is fighting the trend — skip.
4. Zone Is Too Wide
If the zone (from origin candle low to high) is wider than 100 pips on US30 or 200 pips on NAS100, the stop placement is too wide for a reasonable R:R. Skip and wait for a tighter zone.
5. No Rejection at the Zone
If price enters the zone and spends multiple candles inside it without rejecting, the zone is absorbing rather than rejecting. After 3+ H1 candles inside the zone, the setup degrades significantly.
6. High-Impact News Within 30 Minutes
Index behaviour during major US data releases (NFP, CPI, FOMC, GDP) overrides zone behaviour. Skip zone trades during these windows.
The "Zone Will Hold" Trap
Beginners treat demand/supply zones as guaranteed support/resistance. But zones are order clusters — and order clusters get filled. A zone holds when the orders at that level exceed the selling pressure against it. When the selling pressure is greater (trend day, news event, extended trend), the zone breaks.
The sign that a zone is failing: price enters the zone and stays inside it for 3+ H1 candles without rejecting. A strong zone produces a fast, sharp rejection within 1-2 candles. If price lingers, it is absorbing the orders — the next move is likely through the zone, not away from it.
Where It Works
-
Trending US indices (US30, NAS100, SPX500) on the Daily: These indices produce clean demand zones during bullish phases and clean supply zones during corrections.
-
First-touch zones with strong departures: Fresh zones where the impulse was 200+ pips and the origin was tight (2-3 candles) produce the highest-probability rejections.
-
US session hours (1330-2000 GMT): Index zone reactions are most reliable during the US trading session when volume is highest.
-
After earnings season volatility settles: The first few weeks after earnings season produces clean trending conditions with well-defined zones.
-
When the Daily bias aligns with the zone direction: A demand zone in a Daily bullish trend is the highest-grade setup.
Where It Fails
-
Ranging or choppy index conditions: Zones break frequently in ranges. The strategy requires trending structure.
-
During major US economic releases: NFP, CPI, FOMC can gap through zones instantly. Avoid zone trades around these events.
-
Wide, messy zones (100+ pips on US30): Wide zones produce wide stops and poor R:R. Skip them.
-
Retested zones: Second and third touches of the same zone have significantly lower probability. Only trade fresh zones.
-
Overnight hold risk: Index gaps can trigger stops. Consider closing positions before the US session close if the target is not reached.
-
Low-volume periods (pre-market, post-market): Zone reactions during thin-volume periods are unreliable.
Known Limitations
-
Zone identification is subjective. The "origin candle" can be interpreted differently by different traders. Choose a consistent method and apply it the same way every time.
-
Indices have wider spreads and higher per-pip costs than major forex pairs. The minimum R:R requirement is 2:1 to compensate.
-
Supply/demand zones work best in trending conditions. In choppy, range-bound indices, zones are broken frequently and produce false signals.
-
The strategy requires patience — price may take days to return to a zone. Many zones are never retested at all (the trend continues without pulling back).
-
Index markets have overnight gaps (especially US30 and NAS100). A gap through your zone can trigger your stop before you can react. Consider this risk when holding positions overnight.
Visual Examples
Evidence & References
Seiden's publicly documented supply/demand methodology defines zones as areas where price left quickly due to an order imbalance. The "base" is the consolidation before the impulsive move. When price returns, remaining unfilled orders may create a second reaction. This framework applies that logic to index markets with session-based timing.
Seiden, S. Online Trading Academy educational materials (public). Various publications 2005-2020.
Academic research on equity market microstructure supports the concept that institutional order placement at specific price levels creates recurring reactions. Documented in market microstructure literature: large orders influence short-term price dynamics in a predictable directional manner around entry levels.
O'Hara, M. (1995). Market Microstructure Theory. Blackwell Publishers.
Research Notes
Supply and demand zone concepts in practitioner literature.
The supply/demand framework is rooted in auction market theory, which describes price as a continuous negotiation between buyers and sellers at different levels.
References:
- Dalton, J. (1990). Mind Over Markets. Documents auction market theory and the concept of value areas where institutional order flow concentrates.
- Steidlmayer, P. (1986). Market Profile. Describes price distribution and the formation of high-volume zones that act as future support/resistance.
- Brooks, A. (2012). Trading Price Action Trading Ranges. Documents failed breakout patterns and institutional trapping behaviour at zone boundaries.
- Murphy, J. (1999). Technical Analysis of the Financial Markets. Support/resistance concepts that underpin zone-based trading.
Validation: Track 30+ zone setups on your chosen index. Record fresh vs retested, zone width, departure strength, and outcome. Your data will show which zone characteristics produce the highest win rate.
Learn the Full Framework
The concepts behind this strategy are covered in the Foundations course.
Start the Course →Full Documentation
Annotated examples, failure breakdowns, and complete evidence.
View VIP Access →