Overview
A trend-following framework for major forex pairs that enters on the first retest after a confirmed Break of Structure on the H4 chart. Uses Daily directional bias as context filter and H4 BOS as the entry trigger zone.
Before using this strategy:
When to Use This Strategy
- ✓Daily chart shows clear bullish (HH/HL) or bearish (LH/LL) structure
- ✓H4 swing point broken by a full-bodied candle close
- ✓Price is pulling back to retest the flipped level
- ✓Trading EURUSD, GBPUSD, or USDJPY during London/NY sessions
When NOT to Use It
- ✗Daily structure is ambiguous or ranging
- ✗The BOS candle was small and grinding (weak break)
- ✗Price did not pull back — it continued without retesting
- ✗The same setup exists on correlated pairs (do not double-expose)
Framework Overview
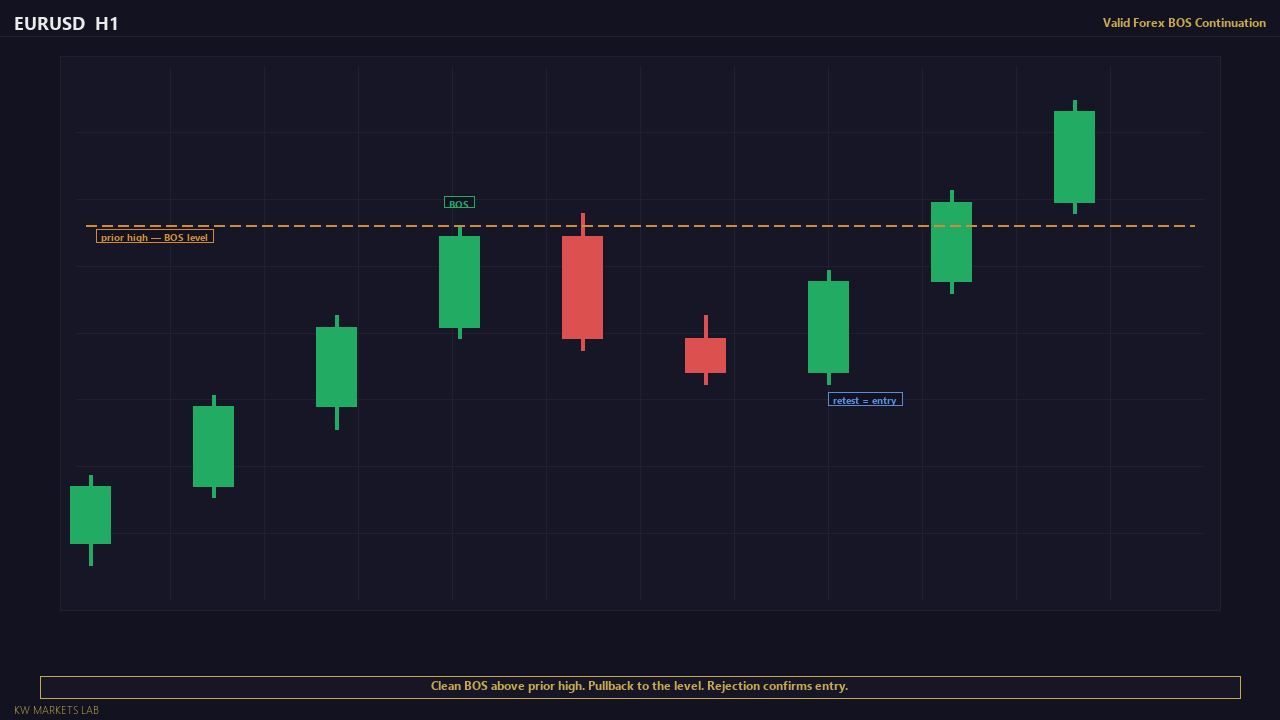
The Break of Structure (BOS) Continuation is the most reliable trend-following entry model in price action trading. The concept is straightforward: when price breaks a significant swing point in a trending market, the broken level often acts as a new support or resistance zone. The first retest of that flipped level — if it holds — is the entry.
This is not a breakout strategy. You are not entering on the break itself. You are waiting for the pullback to the broken level, confirming that the level has flipped its structural role, and then entering in the direction of the established trend. The distinction matters because breakout entries carry significantly higher false-break risk.
Why This Works
The BOS continuation model works because of how institutional order flow interacts with structural levels. When a swing high is broken in an uptrend, traders who were short at that level are stopped out. Their stop-loss orders (which are buy orders) create demand. Simultaneously, breakout traders enter long, adding buying pressure. The pullback to the broken level occurs as short-term profit-taking absorbs the initial momentum — but the structural demand at the flipped level remains. When price retests this demand and holds, the second wave of buying produces the continuation move.
The same logic applies in reverse for bearish BOS. A broken swing low becomes resistance. The pullback retest is the entry short.
Framework Requirements
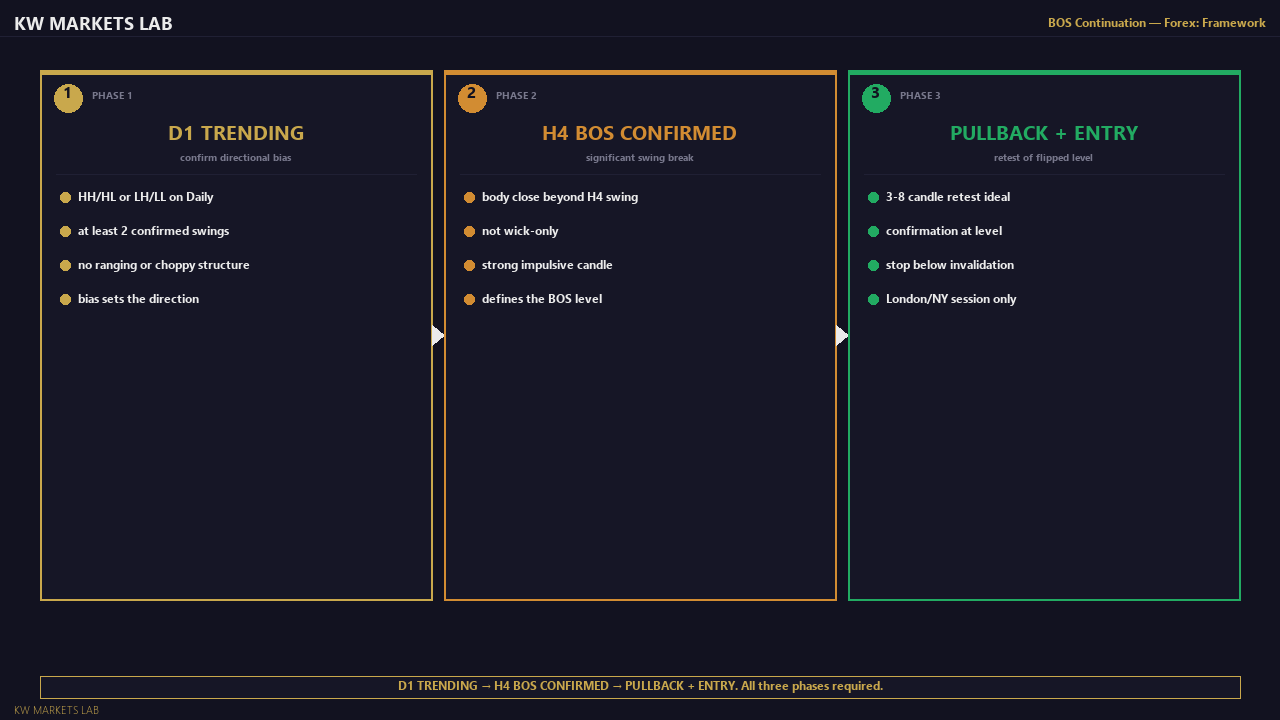
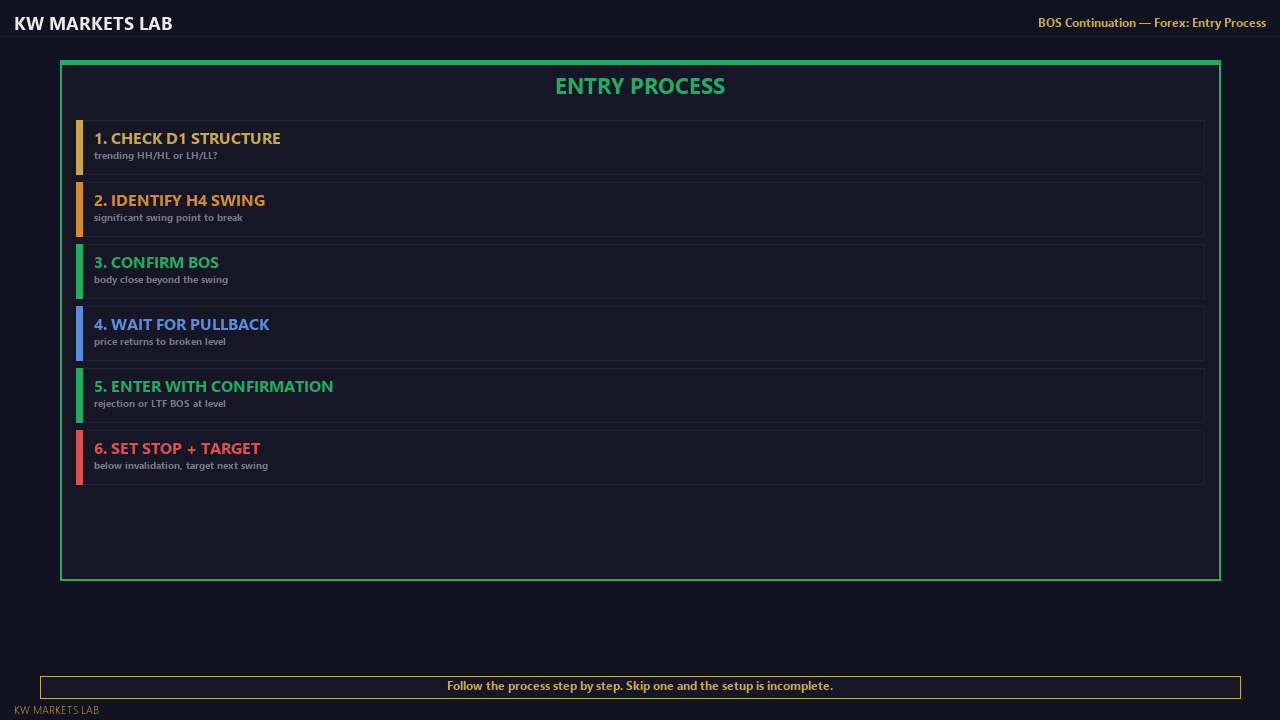
This strategy requires three aligned conditions before any trade is considered:
-
Daily Bias — The Daily chart must show a clear trending structure. Bullish: higher highs and higher lows. Bearish: lower highs and lower lows. If the Daily is ranging or ambiguous, this strategy does not apply.
-
H4 Break of Structure — A significant H4 swing point must be broken by a candle body close beyond the level. Wick-only penetrations do not qualify as a confirmed BOS. The swing point should be meaningful — ideally a swing that has been respected at least once before.
-
H4 Pullback and Retest — After the BOS, price must pull back to the broken level. The entry is placed at or near the flipped level when price shows signs of holding (rejection candle, H1 BOS at the level, or a clean touch-and-bounce).
Timeframe Cascade
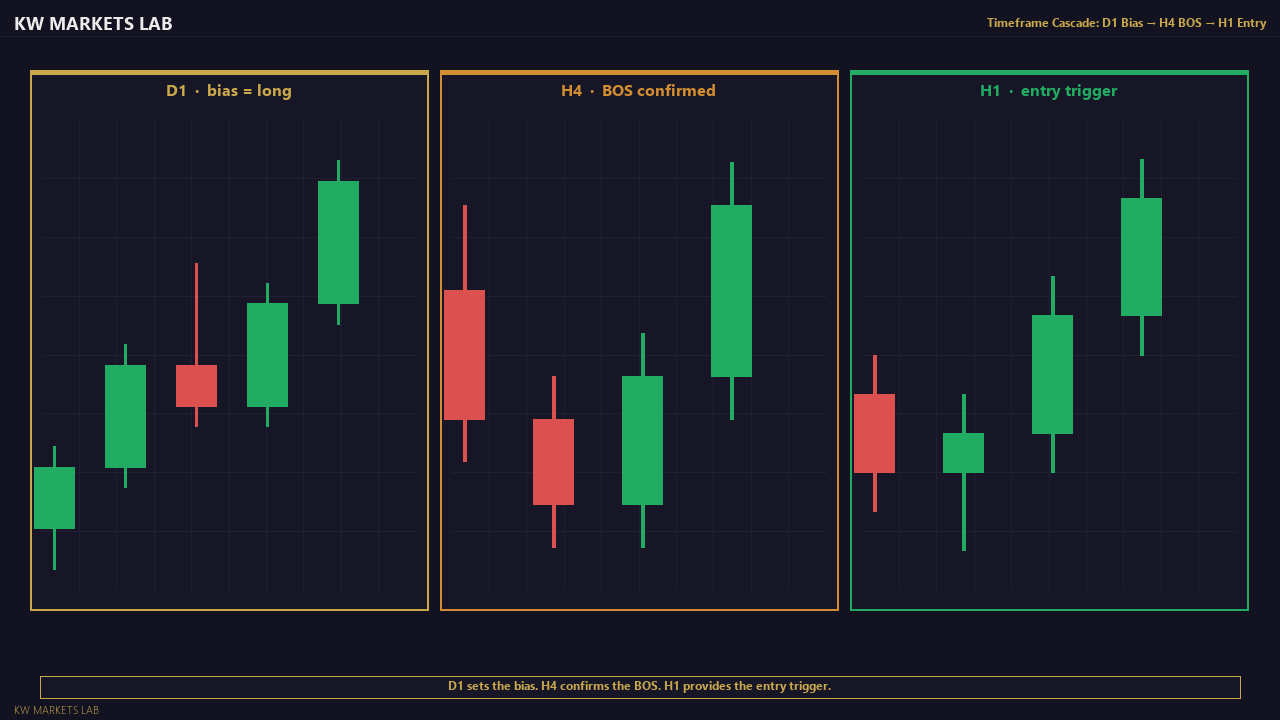
The strategy uses a two-timeframe cascade: Daily sets the directional context, H4 provides the structural setup and entry trigger. You may use H1 for precise entry timing within the H4 setup zone, but the trade is defined by D1+H4 alignment.
If you want to add a lower-timeframe confirmation (H1 BOS at the retest level), this increases confidence but reduces the number of valid setups. Both approaches are valid — choose one and apply it consistently.
What This Strategy Is Not
This is not a scalping strategy. Minimum hold time is typically 4-12 hours. Targets are structural — the next significant H4 swing point — not fixed pip counts. This is a medium-frequency strategy: you may see 2-4 setups per week across 4-5 major pairs.
This strategy does not attempt to predict reversals or call tops/bottoms. It enters in the direction of the established trend and requires the trend to be confirmed before the setup is valid.
Market Conditions Required
This strategy requires a specific market state. Before looking for a BOS setup, confirm:
- The Daily chart shows at least two completed HH/HL pairs (bullish) or LH/LL pairs (bearish) — not one, not "almost." Two confirmed pairs minimum.
- The H4 chart is not in a wide range. If the last 20 H4 candles are oscillating between two flat levels, this is a range — not a trend. BOS signals in ranges are noise.
- The pair is not approaching a major higher-timeframe supply/demand zone. A BOS that runs directly into Weekly resistance has a high failure rate because the structural context above is working against you.
- Volatility is normal. If today's Daily candle has already exceeded 1.5x the pair's average Daily ATR, the market is in an outlier state. BOS entries in outlier conditions have reduced follow-through.
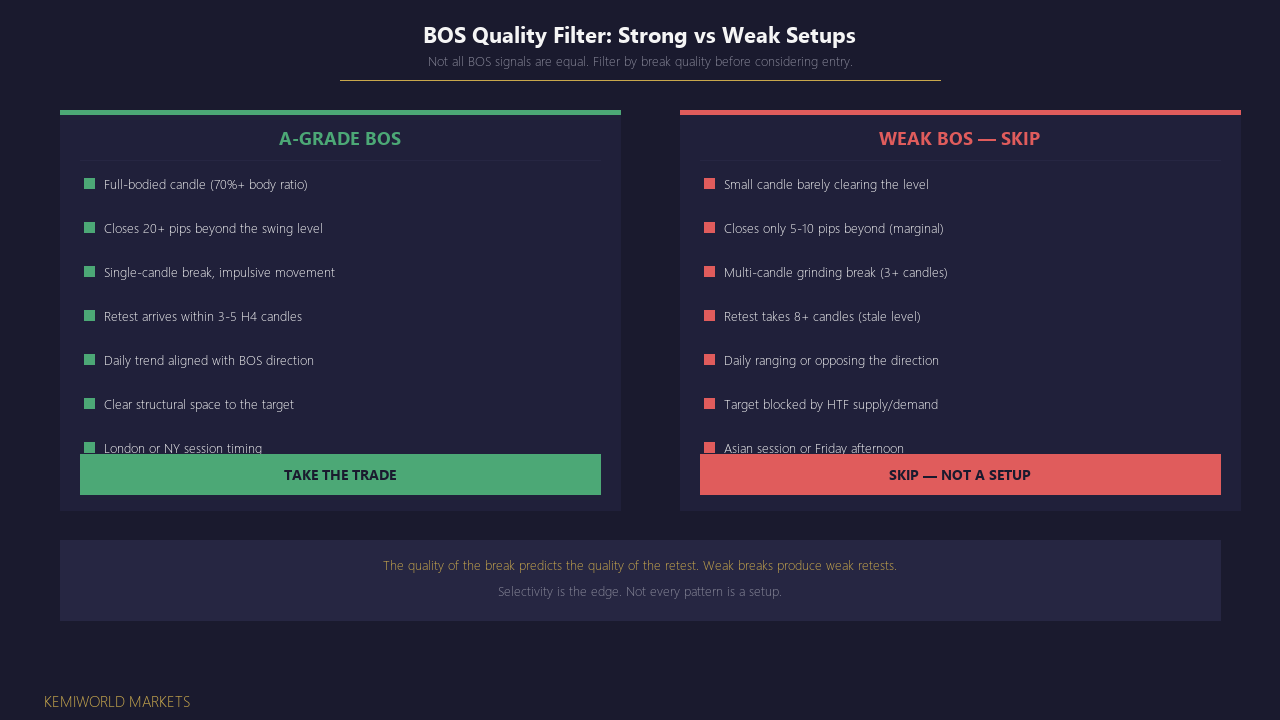
What Makes This Setup Weak
Not all BOS setups are equal. A weak BOS has one or more of these characteristics:
- The breaking candle is small and grinding — less than 60% body-to-range ratio. A strong BOS is a full-bodied candle that closes well beyond the level. A weak BOS barely clears it.
- The swing level that was broken was minor — formed recently, only tested once, or not clearly visible on the H4 chart. Significant levels that have been respected 2-3 times produce the most reliable flipped zones.
- The pullback to the broken level takes too long — more than 8 H4 candles (2 trading days). By then, the market has moved on. The level is stale, and the order density at the flipped zone has been absorbed by other price action.
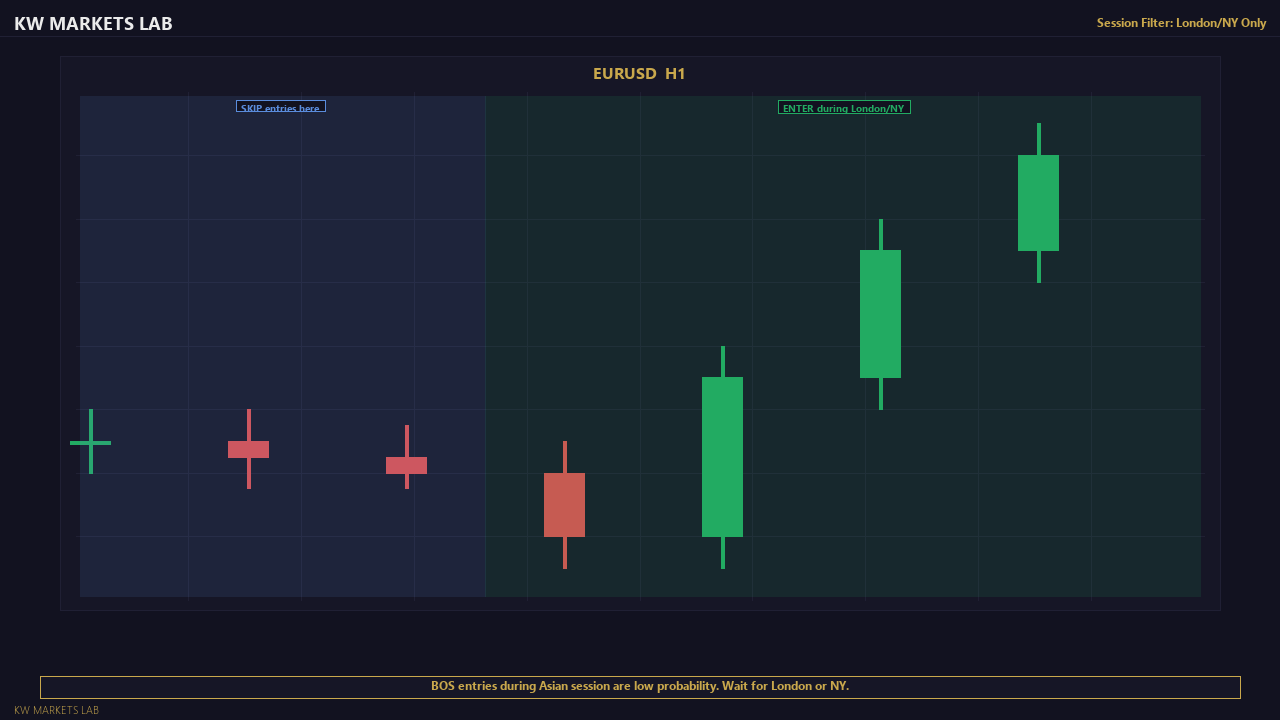
- The retest occurs during Asian session hours. Forex pair retests during Asian have lower follow-through because volume is insufficient to sustain the continuation move.
Common Beginner Mistake
The most common mistake is treating every swing break as a BOS. Beginners mark every minor swing wiggle on M15 or H1 and call it a BOS, producing dozens of false signals per week. The fix: only mark swing points that are clearly visible on H4 without zooming in. If you have to squint to see the swing, it is an internal move — not a structural break. Quality of the swing determines quality of the BOS.
The second most common mistake: entering on the break instead of waiting for the retest. The break itself is the signal that the level may flip — but the entry is the retest. Entering on the break means buying at the session high with no structural stop below you.
What Experienced Traders Notice
Experienced traders evaluate BOS quality before the retest even arrives. They look at:
- The speed of the break. A fast, impulsive break that moves 30+ pips beyond the level in 1-2 candles signals strong institutional participation. A slow grind past the level that takes 4-5 candles signals weak conviction.
- Whether the break was clean or messy. If multiple wicks pierced the level before the body close, the level was contested — and contested breaks produce weaker retests.
- The position in the trend. The first BOS after a consolidation break is the highest probability. The third or fourth BOS in a mature trend is lower probability because the trend is extended and reversal risk increases.
- What is above/below on the Daily. If the BOS target runs into a Daily supply zone 30 pips above the entry, the R:R is insufficient. The best setups have clear structural space to the target.
When to Skip This Trade
Skip the BOS setup when:
- The Daily structure is ranging or ambiguous — even if H4 looks like a BOS, the higher timeframe context undermines it
- The BOS candle was wick-heavy and indecisive — this signals a liquidity sweep, not a structural break
- The retest level is within 15 pips of a high-impact news event window — NFP, CPI, FOMC reactions override structural logic
- You already have an open position on a correlated pair (e.g., long EURUSD and this is a long GBPUSD BOS) — same directional USD exposure, not independent trades
- The R:R to the next structural obstacle is below 1.5:1 — the target must have room to reach
Entry Conditions
Mandatory conditions — all must be present before entry is valid.
1. Daily Chart: Trending Structure
The Daily chart must show a clear trend. For longs: at least two confirmed higher highs and higher lows. For shorts: at least two lower highs and lower lows. If the Daily swing sequence is ambiguous or overlapping, the pair is filtered out for the session.
Do not force a directional read. If you are unsure whether the Daily is trending, it is not trending enough for this strategy.
2. H4 Chart: Significant Swing Point Identified
Identify the most recent significant H4 swing high (for longs) or swing low (for shorts). A "significant" swing is one that:
- Has been respected at least once (price bounced from it previously)
- Is visible on the H4 chart without zooming in
- Is part of the current trend's structural skeleton (not a minor internal swing)
3. H4 BOS Confirmed: Body Close Beyond the Level
A candle body must close cleanly beyond the swing point. This means:
- Bullish BOS: a full candle body close above the prior swing high
- Bearish BOS: a full candle body close below the prior swing low
- A wick-only penetration is NOT a confirmed BOS — it is a potential liquidity sweep
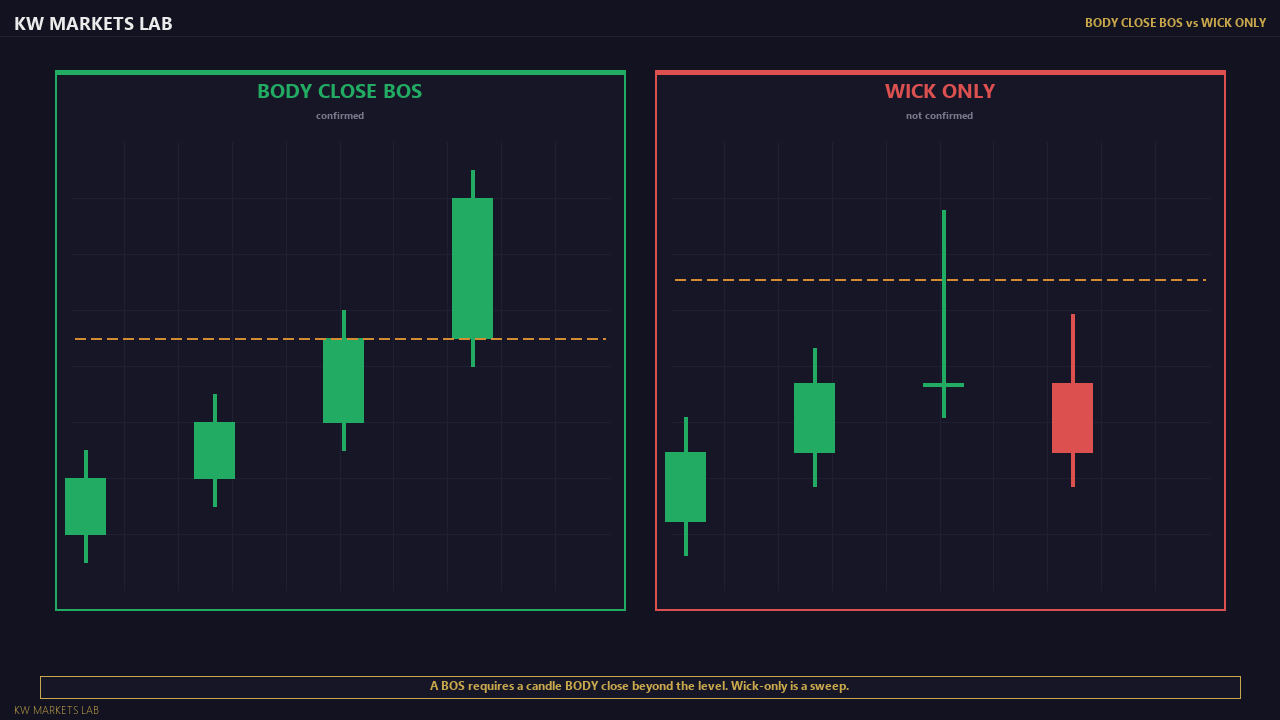
Quality filter: The breaking candle should be a full-bodied candle (at least 60% body-to-range ratio). Small, grinding candles that barely close beyond the level are low-quality BOS and produce weaker retests.
4. Pullback to the Broken Level
After the BOS, price must pull back toward the broken level. The ideal retest:
- Touches or comes within 10-15 pips of the broken level
- Shows a rejection signal (long lower wick for bullish, long upper wick for bearish)
- Occurs within 3-8 candles of the BOS (if the retest takes too long, the setup degrades)
5. Entry Trigger
Place the entry at the retest level with one of these confirmation methods:
- Limit order at the broken level (aggressive: higher fill rate, no confirmation)
- H1 rejection candle at the level (moderate: requires candle close confirmation)
- H1 BOS at the level in the direction of the D1 trend (conservative: highest confidence)
6. Session Filter
The retest should occur during London or New York sessions. Asian session retests on forex pairs have lower follow-through due to reduced volume. If the retest forms during Asian hours, wait for London open confirmation before entering.
7. Risk Calculation Before Entry
Stop loss distance must be defined before the entry is placed. Position size must be calculated from the stop distance, not estimated. Risk per trade: 1% of account balance. No exceptions.
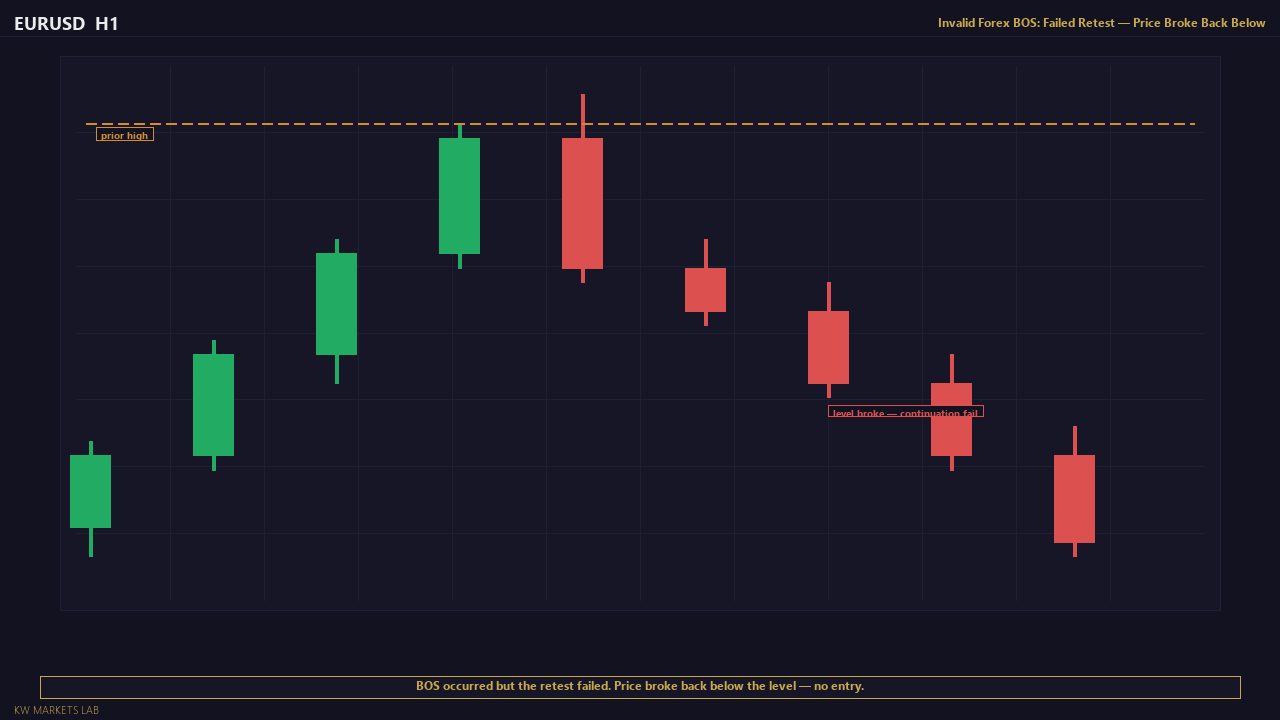
Failed Setup Example: Why This BOS Was Not Tradeable
GBPUSD Daily is bullish. H4 shows a swing high at 1.2750. An H4 candle closes at 1.2755 — 5 pips above the level. The candle is small with a long upper wick (35% body ratio). The "break" took 3 candles of grinding. Price pulls back to 1.2748 during Asian session.
Why this fails: the BOS candle was weak (small body, grinding), the pullback arrived during low-volume Asian hours, and the break only cleared the level by 5 pips. A strong BOS clears the level by 15-30+ pips with a full-bodied candle. This setup should be skipped — the structural evidence is too thin.
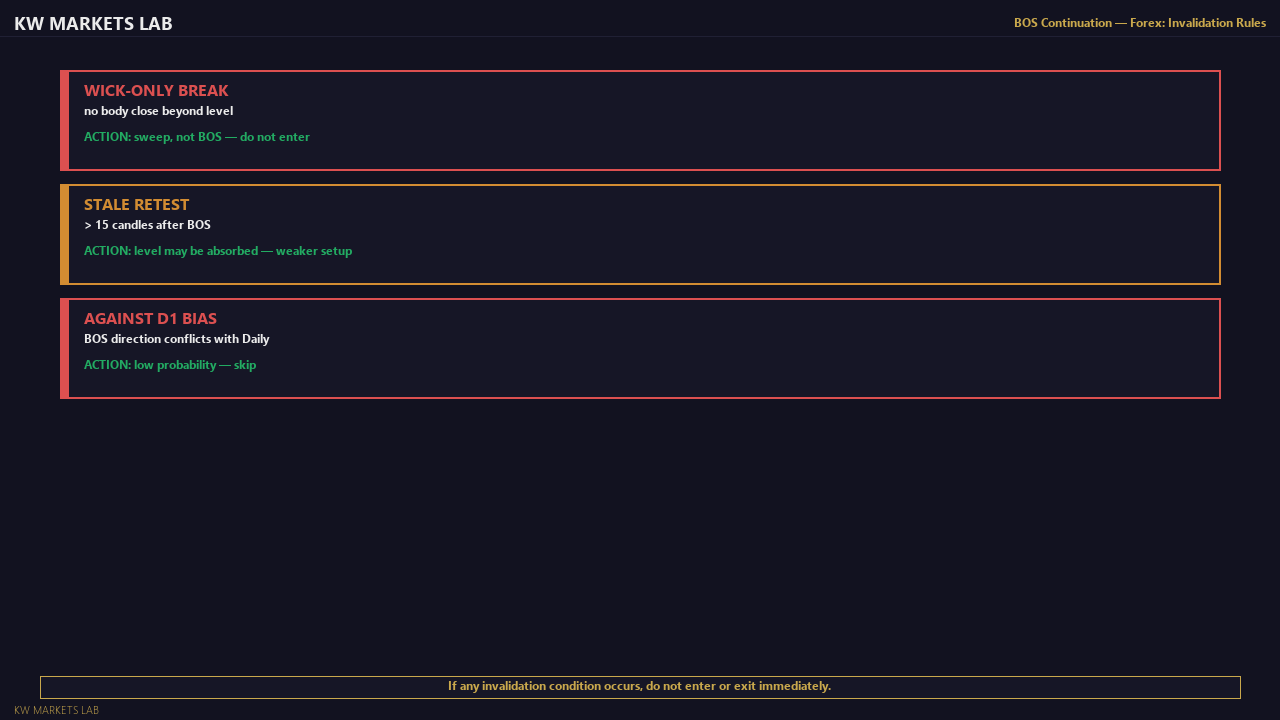
Invalidation & Risk Rules
Any of the following conditions invalidate the setup — do not enter.
1. False Break (Body Close Back Through the BOS Level)
If price breaks the swing level but then a subsequent H4 candle body closes back through the level in the opposite direction, the BOS is invalidated. This is a false break — not a structural change. The original swing point is still intact.
This is the single most important invalidation rule. A false break that you trade as a real BOS will produce a losing trade nearly every time.
2. Price Does Not Pull Back
If price breaks the swing level and continues directly to the target without retesting the broken level, the trade is missed. Do not chase price. Do not enter mid-move hoping for a late entry. The retest is the setup — without it, there is no trade.
3. Daily Structure Changes Before Retest (CHoCH)
If the Daily chart produces a Change of Character (lower low in a previously bullish structure, or higher high in a previously bearish structure) before the H4 retest occurs, the directional bias is no longer valid. Cancel the pending order and re-evaluate.
4. Retest Coincides with High-Impact News
If the retest zone is reached within 30 minutes of a high-impact news event (NFP, CPI, FOMC, rate decisions), do not enter. News-driven price action produces unreliable structural behaviour. Wait for the post-news structure to settle (minimum 15 minutes after the event).
5. Wick-Only BOS
If the "break" of the swing level was a wick-only penetration (no candle body close beyond the level), this is not a BOS. It is a liquidity sweep. The correct read is that the swing level held — the trend continuation signal has not fired.
6. Multiple Failed Retests
If price retests the broken level and is rejected once but then returns to retest it again, the level is degrading. After two failed holds at the retest level, the setup is invalid. A strong flipped level holds on the first touch.
The "Almost BOS" Trap
One of the most costly patterns for beginners: price pushes through the swing level by a few pips, you enter the "retest," and then price reverses through the level entirely. This happens because the initial break was a stop hunt (liquidity sweep above the swing high) rather than a genuine structural break.
How to distinguish:
- A genuine BOS produces a full-bodied candle that closes 15+ pips beyond the level on major forex pairs. A stop hunt produces a wick through the level that closes back below it — or a tiny body that barely clears it.
- After a genuine BOS, price typically moves 30-50+ pips beyond the level before any retracement begins. After a stop hunt, price reverses within 1-3 candles.
- If the "BOS" occurred on a single high-wick candle during a kill zone or news event, it is more likely a sweep than a structural break.
Rule: if you are uncertain whether the break was genuine, it was not strong enough. Wait for the next one.
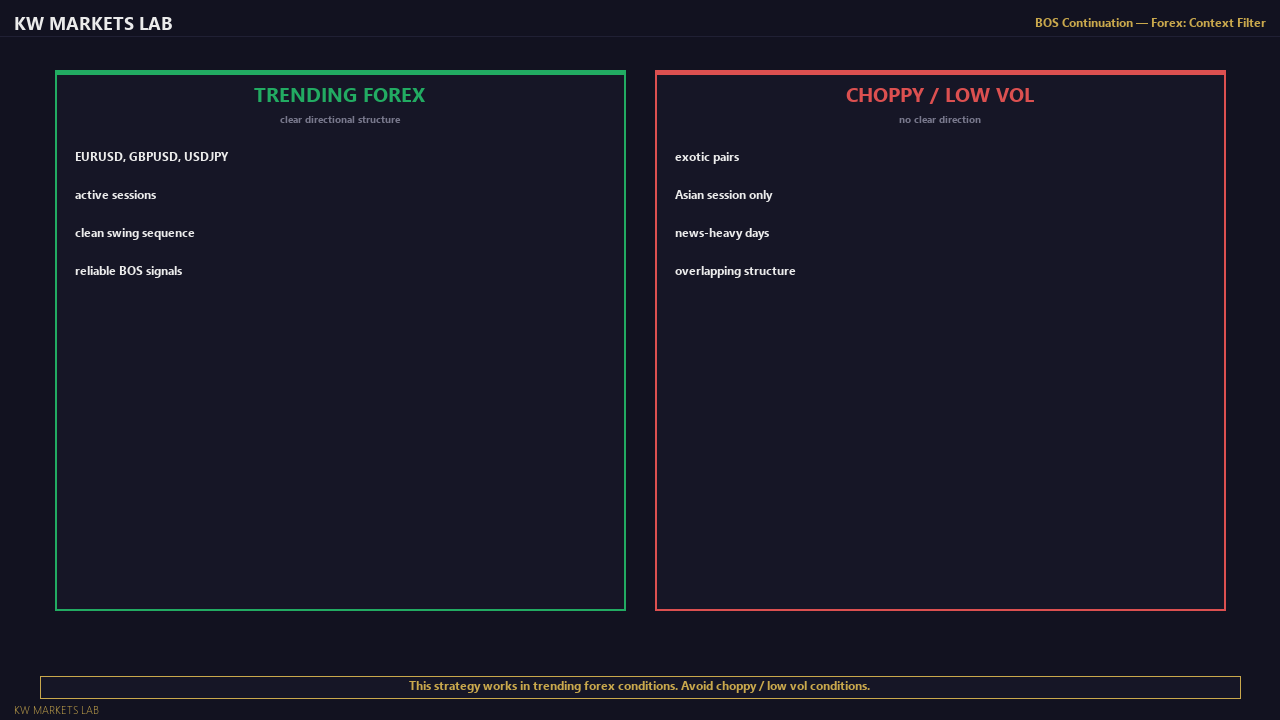
Where It Works
Best conditions for this strategy — where it has the highest structural reliability.
-
Trending major pairs: EURUSD, GBPUSD, USDJPY, AUDUSD when the Daily chart shows clean HH/HL or LH/LL structure. These pairs offer tight spreads, deep liquidity, and clean structural behaviour.
-
Post-consolidation breakouts: When price breaks out of a multi-day range on the Daily, the first H4 BOS within the new trend often produces a very clean retest. The consolidation creates a base of unfilled orders that supports the retest.
-
London and New York sessions: The majority of reliable retests occur during high-liquidity windows (0700-1100 GMT for London, 1300-1700 GMT for New York). Session timing is a quality filter — not just a convenience factor.
-
After clean, decisive BOS candles: Full-bodied candles that close well beyond the swing level (not grinding, not just barely clearing it) produce the most reliable retests. The quality of the break predicts the quality of the retest.
-
Confirmed Daily trend with room to the next HTF level: The best setups occur when the Daily trend is established AND the next significant resistance/support is far enough away to give the trade room to reach its target.
Where It Fails
Conditions where this strategy consistently underperforms — recognise and avoid these.
-
Choppy or ranging H4 conditions: In range-bound markets, every break of the range boundary looks like a BOS but many are false breaks. The strategy requires a trending structure to function — ranges produce noise, not signal.
-
Low-spread pairs during major news events: A BOS that occurs during NFP, CPI, or FOMC may be news-driven rather than structurally meaningful. The initial break may be valid, but the retest behaviour is unreliable because the market is repricing around new fundamental information.
-
Small or recent swing levels: BOS of a swing high that formed 2 candles ago is less significant than BOS of a swing high that was respected for 10+ candles. Older, more-tested levels produce more reliable flipped zones.
-
Very extended trends (late-trend BOS): When the Daily trend has produced 3-4 consecutive swing points in one direction and price is approaching a major HTF supply/demand zone, the next BOS may be the last one before a reversal. Late-trend BOS trades have lower probability.
-
Friday afternoon (end-of-week position squaring): Friday afternoon often sees position-squaring flows that can produce false retests. If the retest forms after 1500 GMT on Friday, consider waiting for Monday's session.
-
Correlated pair risk: Taking the same BOS setup on EURUSD and GBPUSD simultaneously doubles your USD exposure. If both setups exist, choose the one with cleaner structure and skip the other.
Known Limitations
Honest limitations — understand these before deploying the strategy.
-
BOS identification requires judgement. There is no purely objective rule for what constitutes a "significant" swing level. Two traders analysing the same chart may identify different BOS levels. This ambiguity is inherent in all structural analysis — not a flaw specific to this strategy.
-
The pullback to retest may not occur. In strong trending conditions, price may break the swing level and continue without looking back. This means the trade is missed entirely. Acceptance of missed trades is a required discipline.
-
In transitional conditions (trend losing momentum, approaching a higher-timeframe supply/demand zone), false BOS signals are common. The Daily bias filter helps but does not eliminate this risk.
-
Results vary significantly by pair and market regime. Clean trending pairs (EURUSD, GBPUSD, USDJPY in trend) produce the best results. Pairs that chop frequently (some crosses) produce more false signals.
-
The strategy has a moderate win rate (typically 40-55%) but relies on a positive R:R ratio (target 1.5:1 to 2.5:1) for profitability. If you need a high win rate to feel confident, this strategy will challenge your psychology.
-
Transaction costs are relevant on smaller timeframes. On H4 entries with 30-50 pip stops on major forex pairs, spread impact is manageable. On tighter stops or wider-spread pairs, costs erode edge.
Evidence & References
Murphy's documentation of support/resistance role reversal is the foundational reference for the BOS retest concept. He notes that once a significant resistance level is broken, it often provides support on subsequent pullbacks — directly aligning with the entry logic of this framework.
Murphy, J.J. (1999). Technical Analysis of the Financial Markets. New York Institute of Finance.
Multiple traders documented in Market Wizards describe entering pullbacks in established trends at tested structural levels as a core component of their methodology. The common thread: trend direction identified first, entry on the retest of a broken level second.
Schwager, J.D. (2012). Market Wizards. Wiley.
Research Notes
Academic and practitioner references supporting the structural logic.
The BOS/retest methodology is grounded in documented support-becomes-resistance and resistance-becomes-support (SR flip) principles that have been observed across multiple markets and timeframes.
References:
- Brooks, A. (2012). Trading Price Action Trends. Wiley. Documents the concept of trend continuation via breakout pullbacks across multiple asset classes.
- Murphy, J. (1999). Technical Analysis of the Financial Markets. NYIF. Covers support/resistance role reversal as a foundational principle of technical analysis.
- Schwager, J. (2012). Technical Analysis. Wiley. Documents swing analysis and structural break patterns in trend-following systems.
- Bulkowski, T. (2005). Encyclopedia of Chart Patterns. Wiley. Statistical analysis of continuation patterns including pullback retests after structural breaks.
Important context:
Documentation of a pattern in reference literature does not imply statistical edge without proper testing. These references describe the logic and mechanics of the pattern — they do not guarantee future performance. Your own trade log is the only valid evidence of whether this strategy works for you, with your execution, in current market conditions.
Recommended validation approach:
Paper-trade or demo-trade a minimum of 30 setups before committing real capital. Track win rate, average win (R), average loss (R), and expectancy. If expectancy is negative after 30 trades, the strategy may not suit your execution style or the current market regime.
Learn the Full Framework
The concepts behind this strategy are covered in the Foundations course.
Start the Course →Full Documentation
Annotated examples, failure breakdowns, and complete evidence.
View VIP Access →