Overview
A framework for using Fibonacci retracement levels as one input in a confluence-based entry methodology. Documented as a filter, not a standalone signal. Includes the specific levels used, how to draw retracements, and the failure conditions that must be understood before applying the tool.
Before using this strategy:
When to Use This Strategy
- ✓A clean, completed impulse leg is visible on H4 or Daily
- ✓The 50% or 61.8% retracement aligns with a prior structural level
- ✓The market is trending and you expect a pullback entry
- ✓You want to add confluence to a structural level you already identified
When NOT to Use It
- ✗No structural level aligns with the Fibonacci zone (naked level)
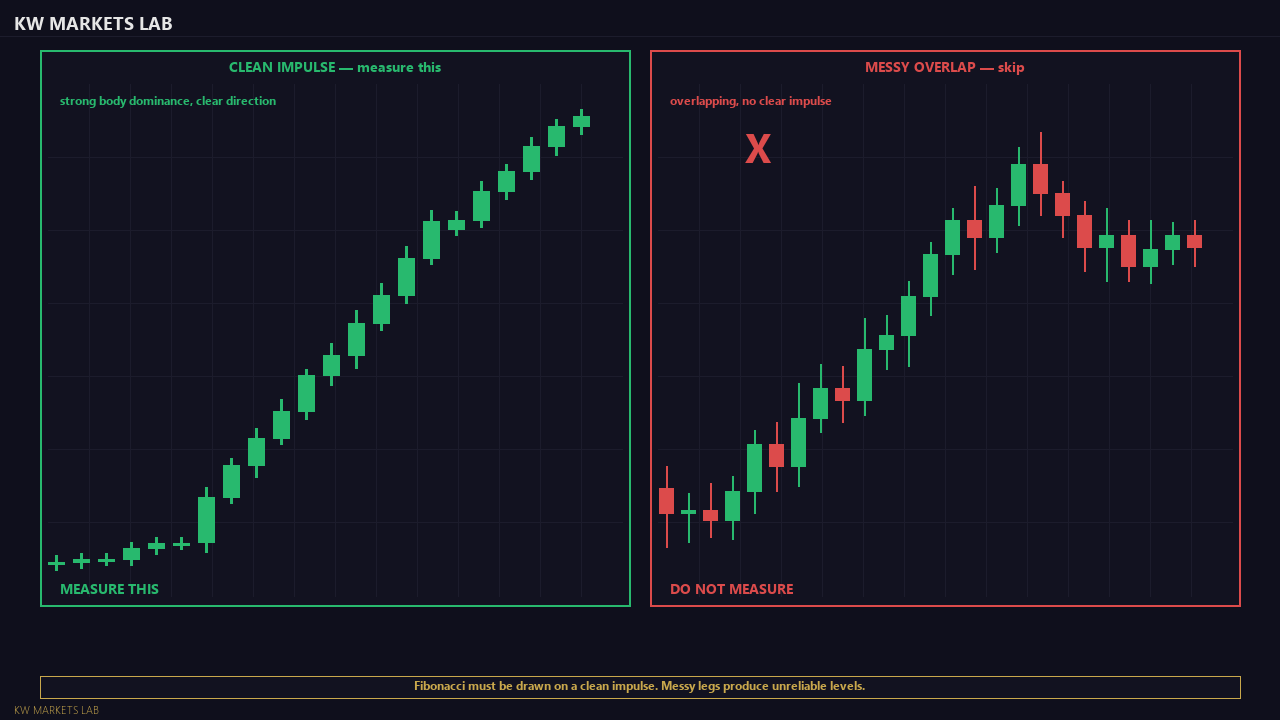
- ✗The impulse leg is messy or overlapping
- ✗The market is ranging with no clear impulse to retrace
- ✗The impulse was driven by a single news candle
Framework Overview
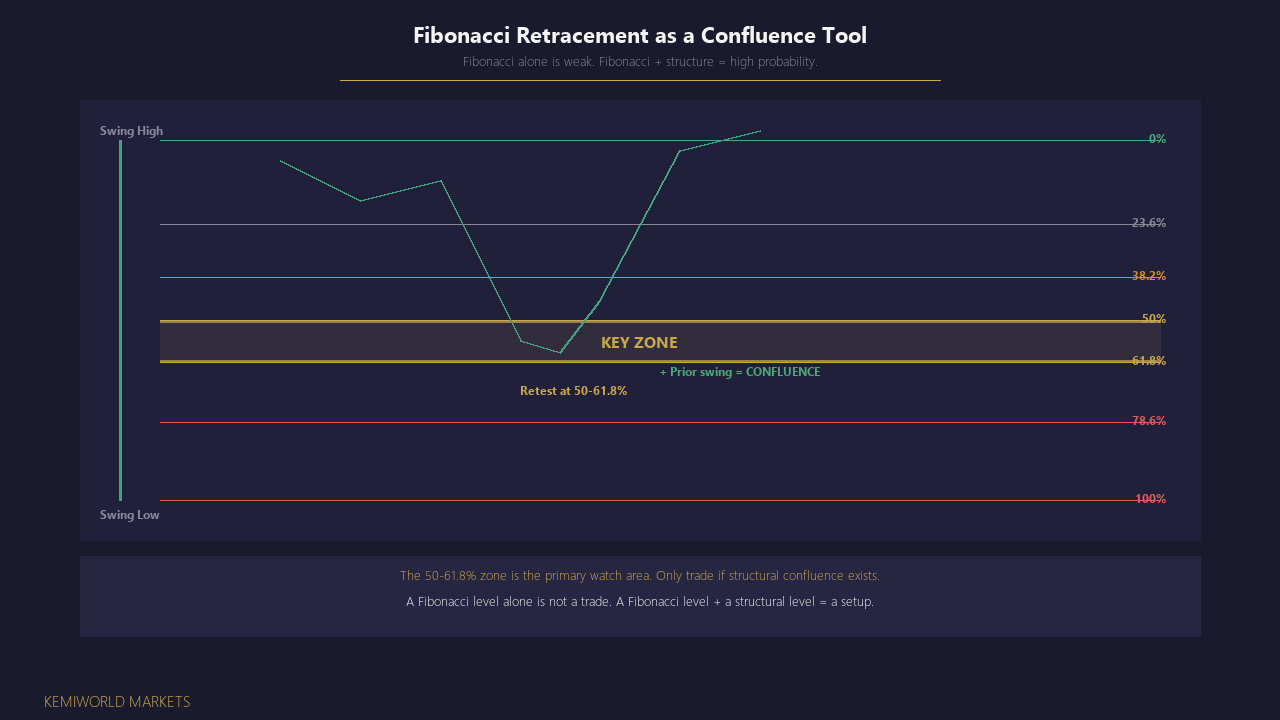
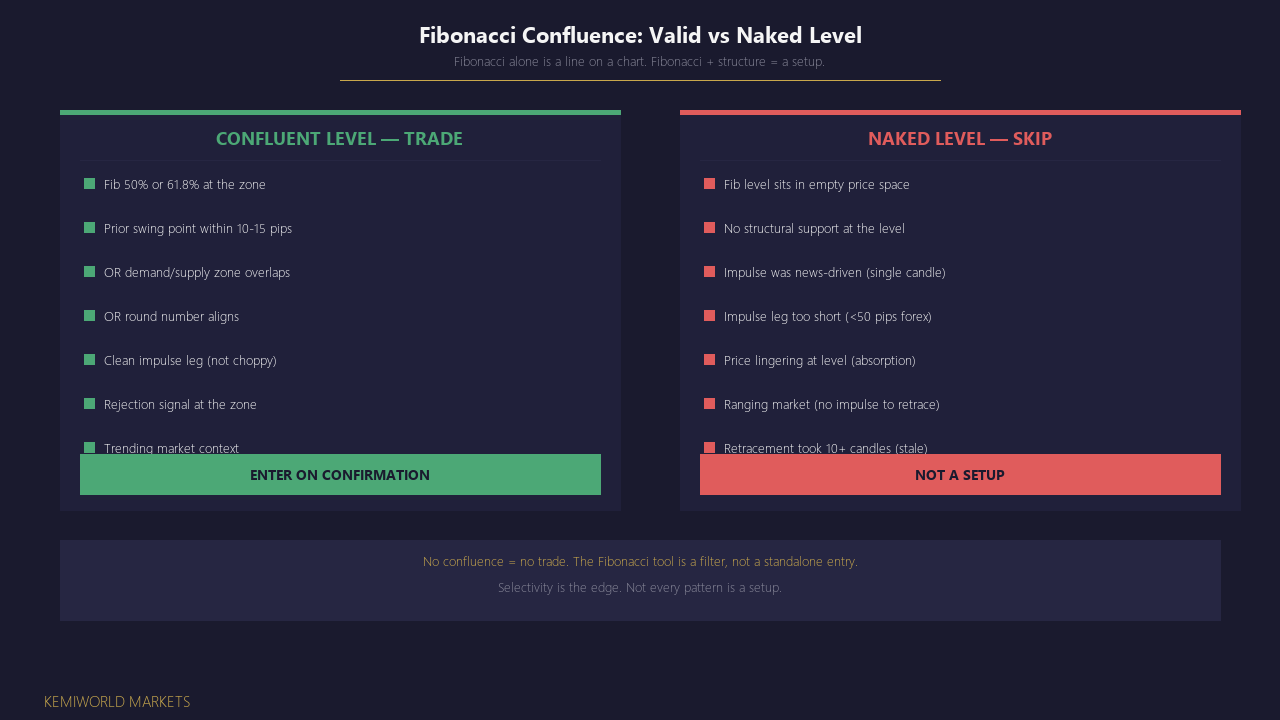
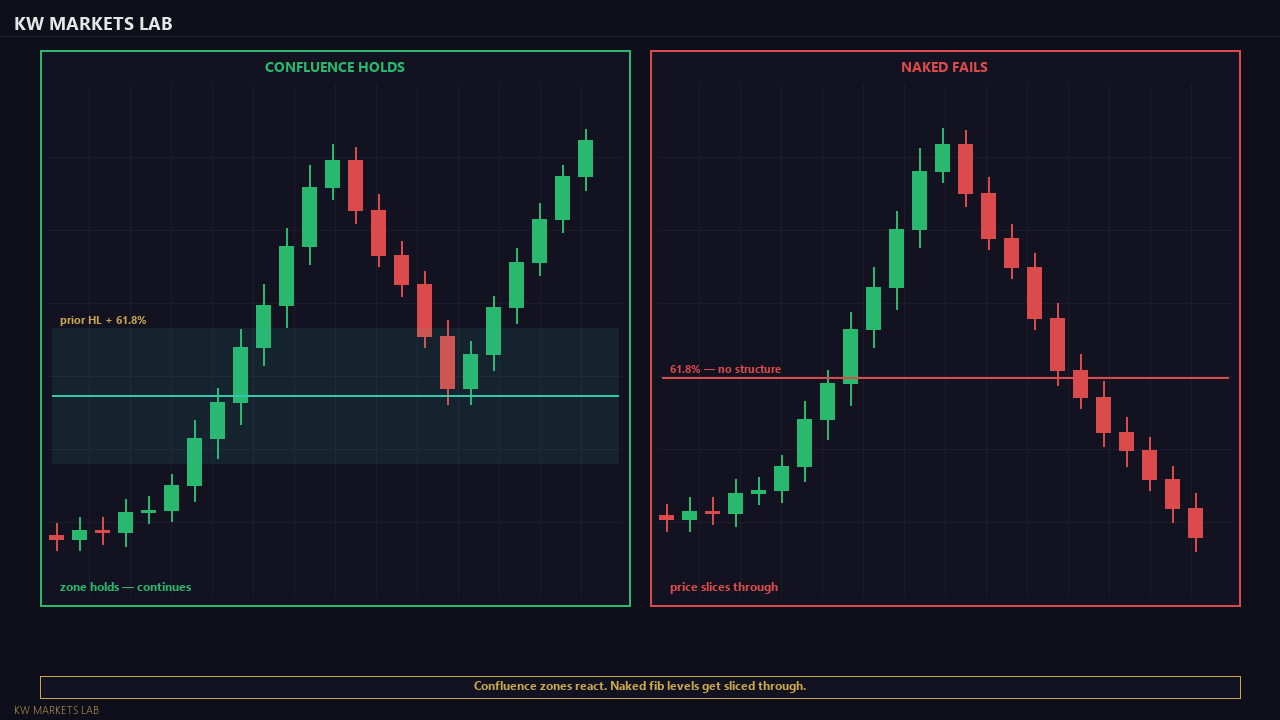
Fibonacci retracement is not a standalone strategy. It is a confluence tool — a way to identify high-probability zones where a pullback in a trending market is likely to find support or resistance. When a Fibonacci level aligns with a structural level (prior swing, supply/demand zone, or round number), the combined zone has higher probability than either level alone.
The Core Concept
When price makes a significant move (an impulse leg) and then pulls back, Fibonacci retracement levels mark specific percentage depths of that pullback. The key levels are:
- 38.2% — a shallow retracement, common in strong trends where momentum is high
- 50.0% — not a true Fibonacci number, but widely watched and frequently acts as a decision point
- 61.8% — the "golden ratio" retracement, the deepest level that a pullback typically reaches before continuing the trend
- 78.6% — a deep retracement that, if reached, suggests the trend may be weakening
These levels are not magic numbers. They work because enough participants watch them to create self-fulfilling order clusters. When a Fibonacci level aligns with a structural level, the order density at that zone increases — and that is what creates the reaction.
How This Strategy Uses Fibonacci
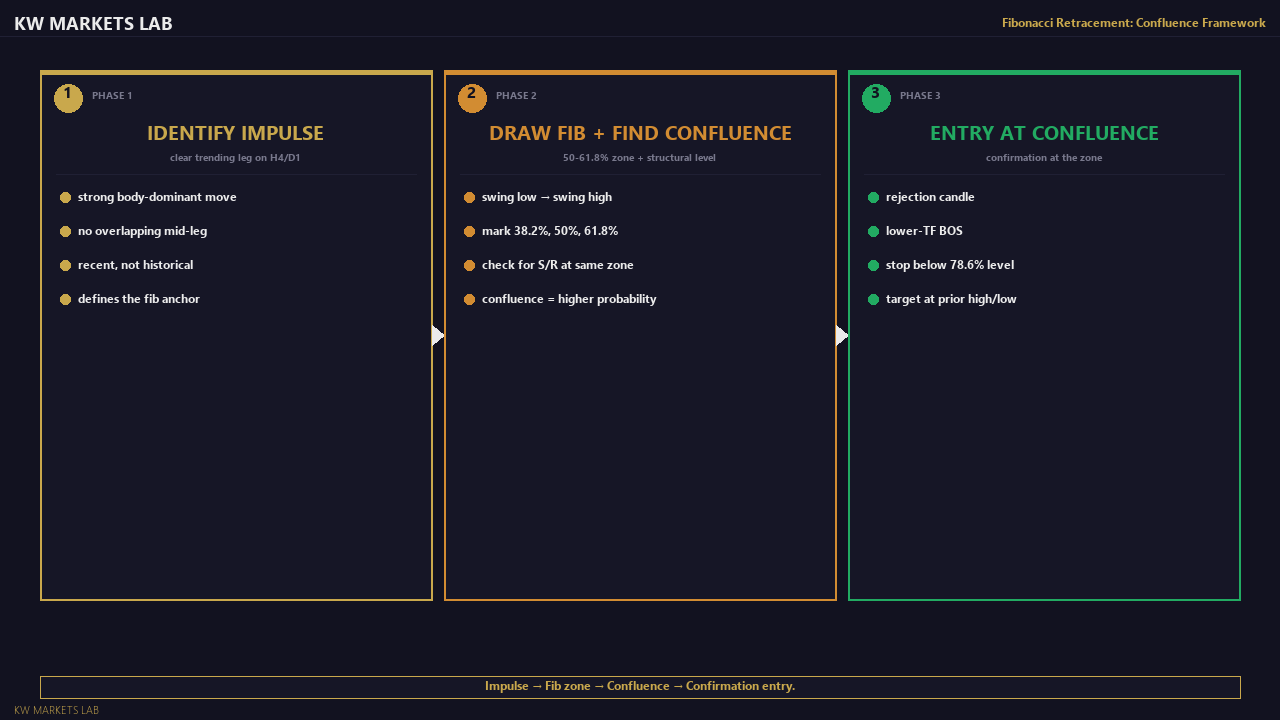
This is a trend-continuation framework. You are not using Fibonacci to predict reversals or to trade counter-trend. The process:
1. Identify a clear trending structure on H4 or Daily (HH/HL for bullish, LH/LL for bearish)
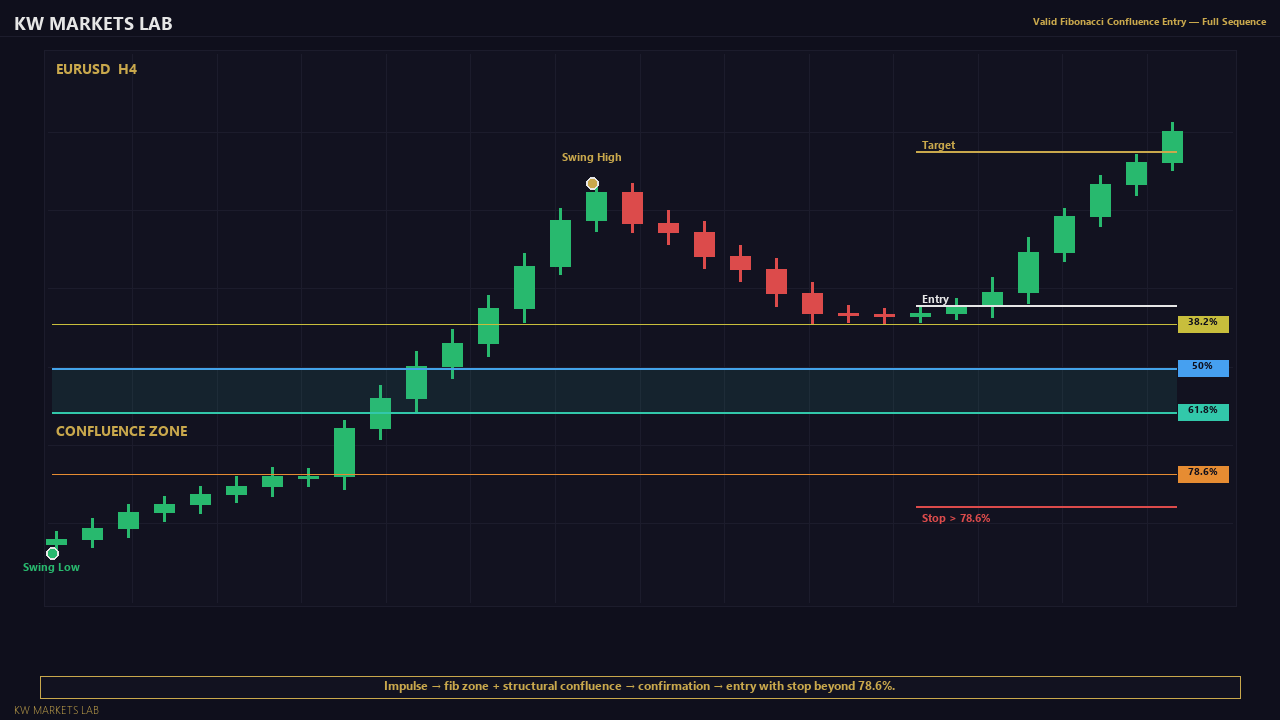
2. Identify the most recent completed impulse leg (swing low to swing high for bullish, or swing high to swing low for bearish)
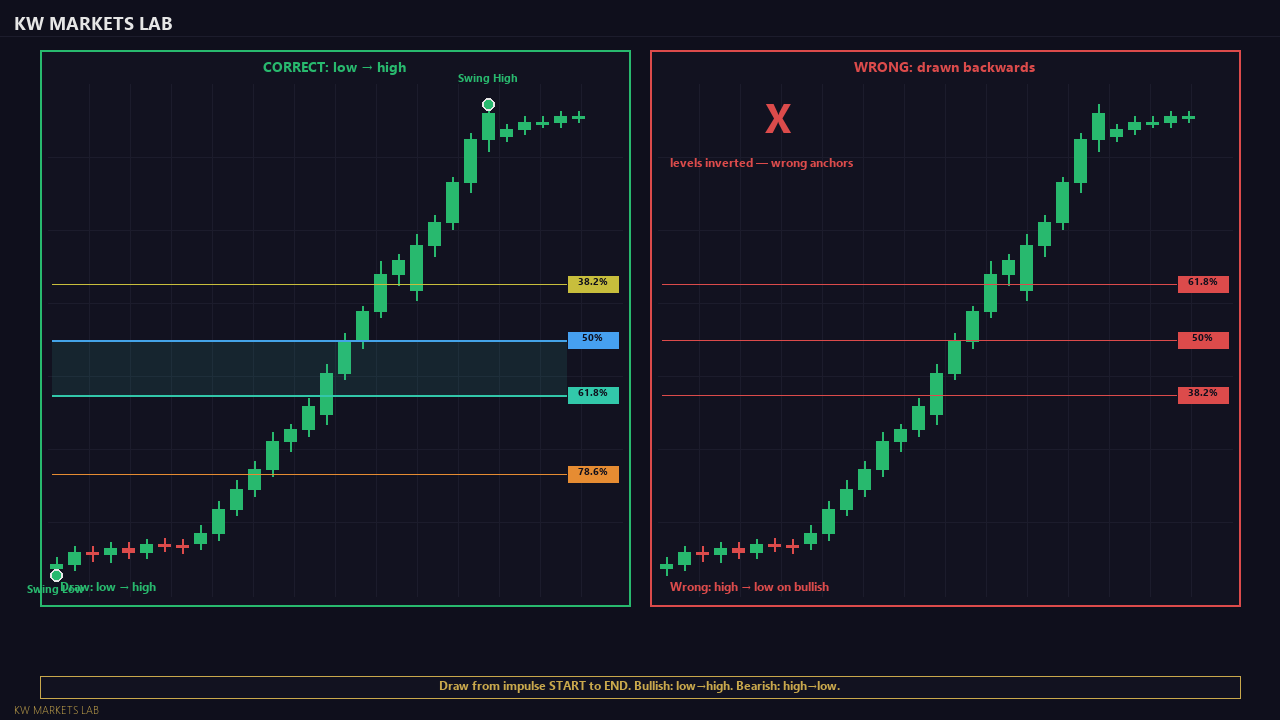
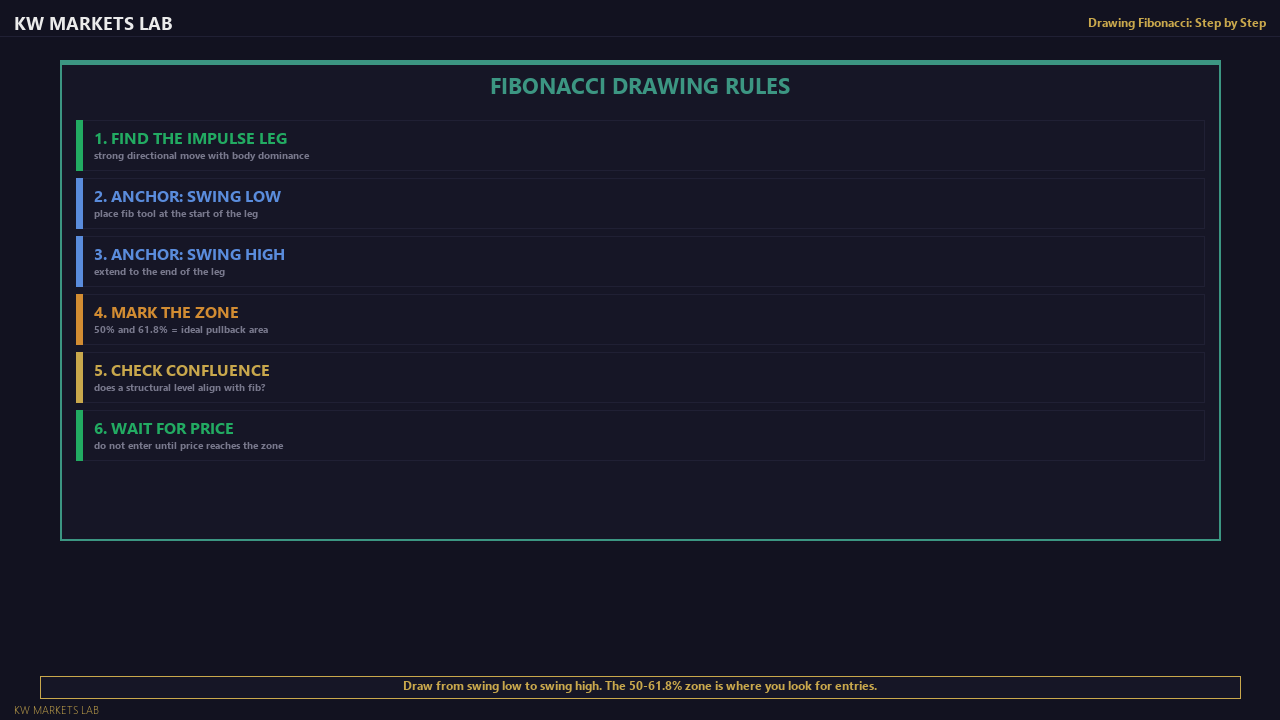
3. Draw the Fibonacci retracement tool from the start to the end of the impulse leg
4. Look for confluence: does the 50% or 61.8% level align with a structural level (prior swing, demand zone, round number)?
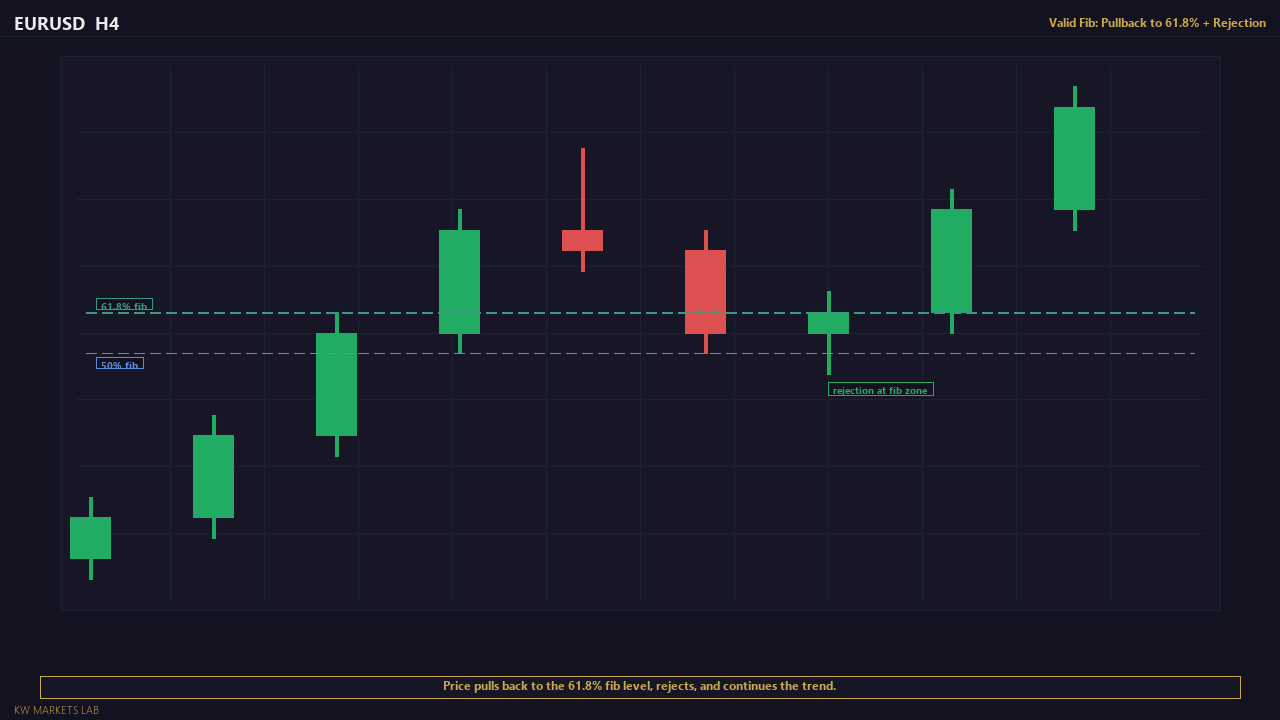
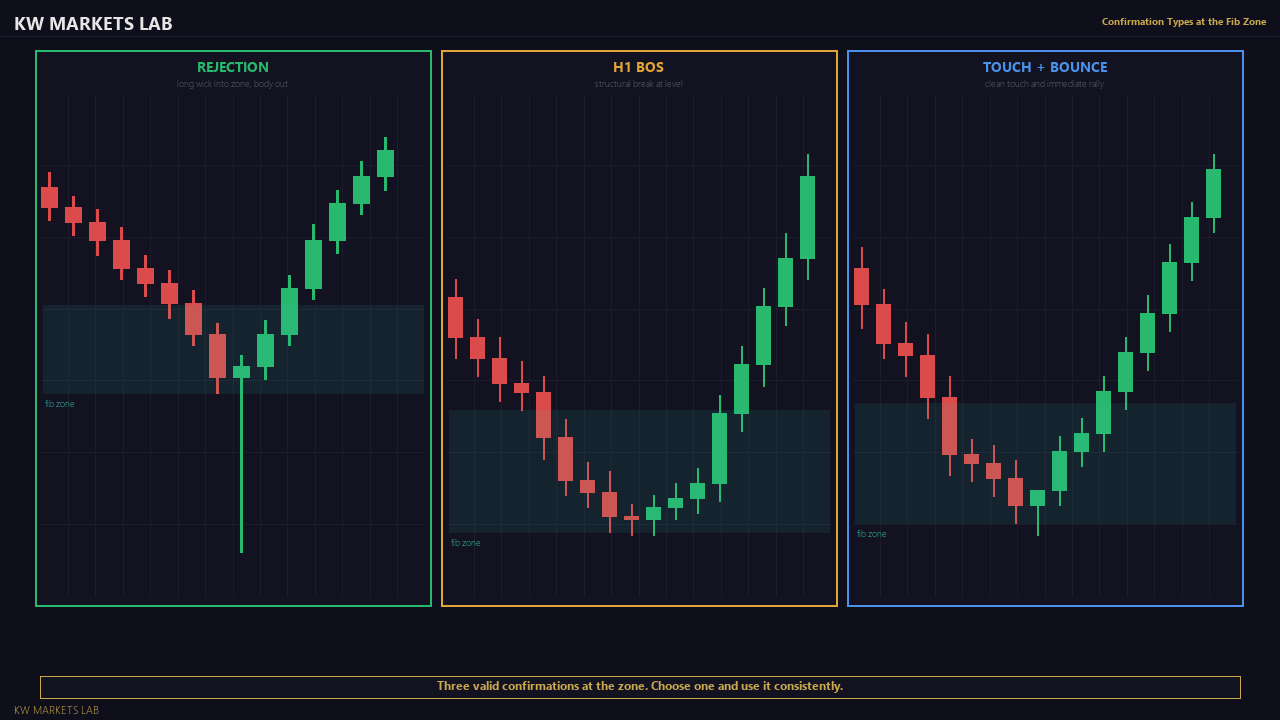
5. If confluence exists, watch for a reaction at the confluent zone — rejection candle, BOS on the lower timeframe, or a clean touch-and-bounce
6. Enter on confirmation with stop beyond the 78.6% level (the final level before the trend is structurally broken)
The Confluence Principle
A Fibonacci level alone is weak. A structural level alone is moderate. A Fibonacci level AND a structural level at the same price zone is a high-probability confluence. This strategy only takes trades where at least two factors align at the retracement zone.
Acceptable confluence factors:
- Fibonacci 50% or 61.8% + prior swing high/low
- Fibonacci level + demand/supply zone from a higher timeframe
- Fibonacci level + round number ($50 levels on gold, .xx00 levels on forex)
- Fibonacci level + session level (Asian high/low, London open)
What This Strategy Is Not
This is not a Fibonacci extension or expansion strategy. It does not project targets — it identifies pullback entry zones. This is not a counter-trend tool. It works WITH the trend, not against it. And critically: Fibonacci retracement is not predictive. It identifies zones of interest — the market decides whether to react.
Market Conditions Required
Fibonacci retracement is only applicable when:
- A clear, completed impulse leg exists on H4 or Daily. The impulse must be the dominant move — not a minor internal swing within a larger range.
- The impulse was structurally driven, not news-driven. A single NFP candle that moved 80 pips is not a clean impulse for Fibonacci purposes — the retracement behaviour of news candles is erratic.
- The market is trending. In ranging conditions there is no impulse to retrace. Drawing Fibonacci on overlapping price action produces meaningless levels.
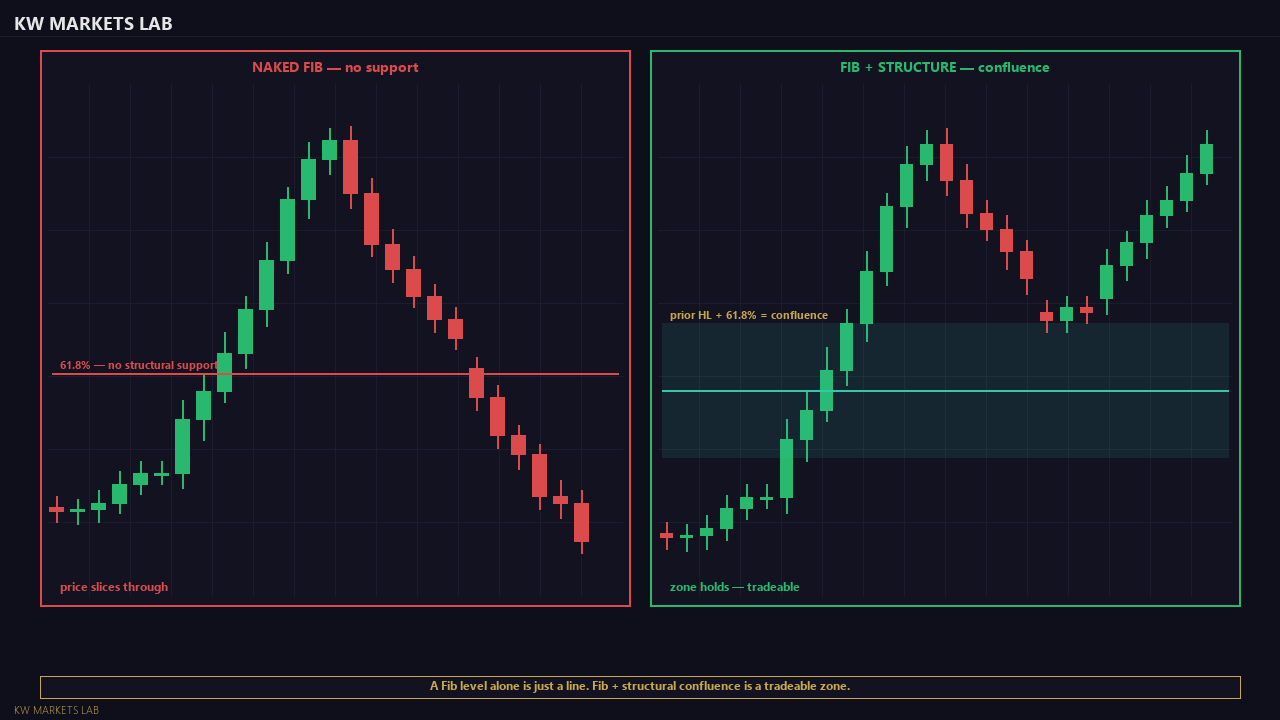
- At least one structural level (prior swing, demand/supply zone, or round number) aligns with the 50% or 61.8% level. Naked Fibonacci = no trade under this strategy.
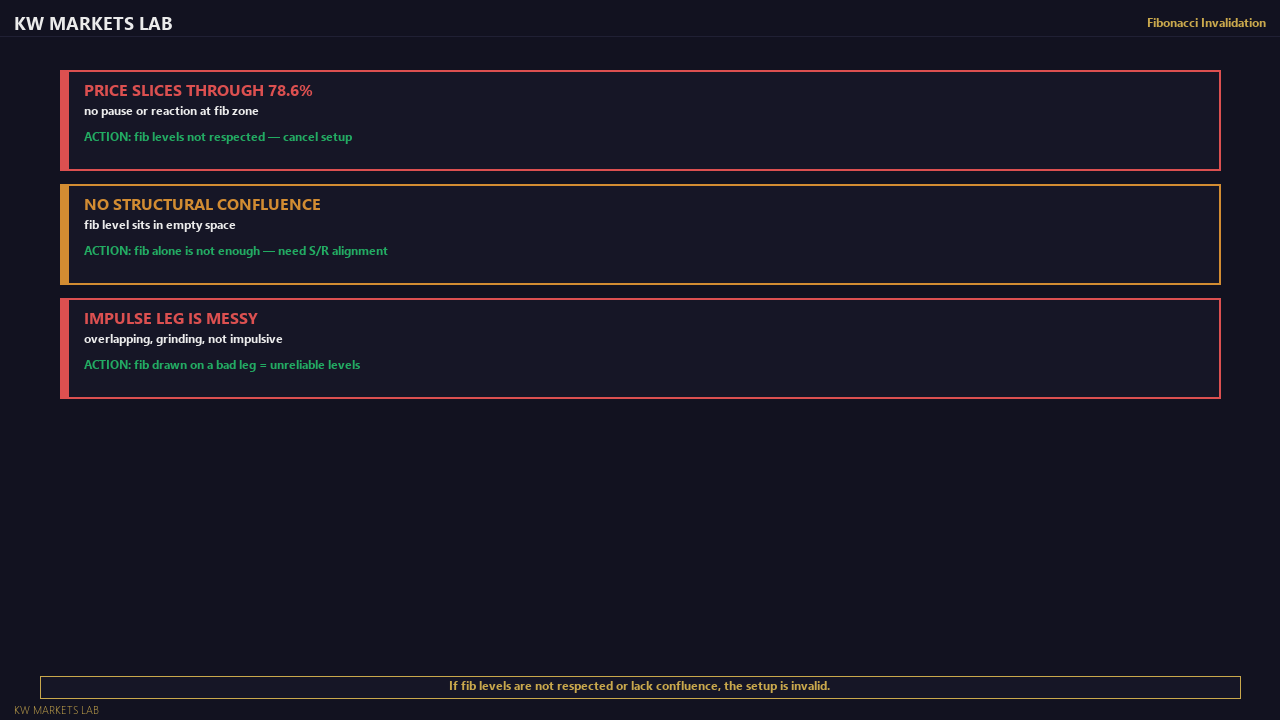
What Makes This Setup Weak
- No confluence. The 50% and 61.8% levels sit in empty price space with no supporting structural evidence. Fibonacci alone is just a line on a chart.
- The impulse leg is short — under 50 pips on forex. The retracement levels are then only 20-30 pips apart, making the zones too narrow for meaningful analysis.
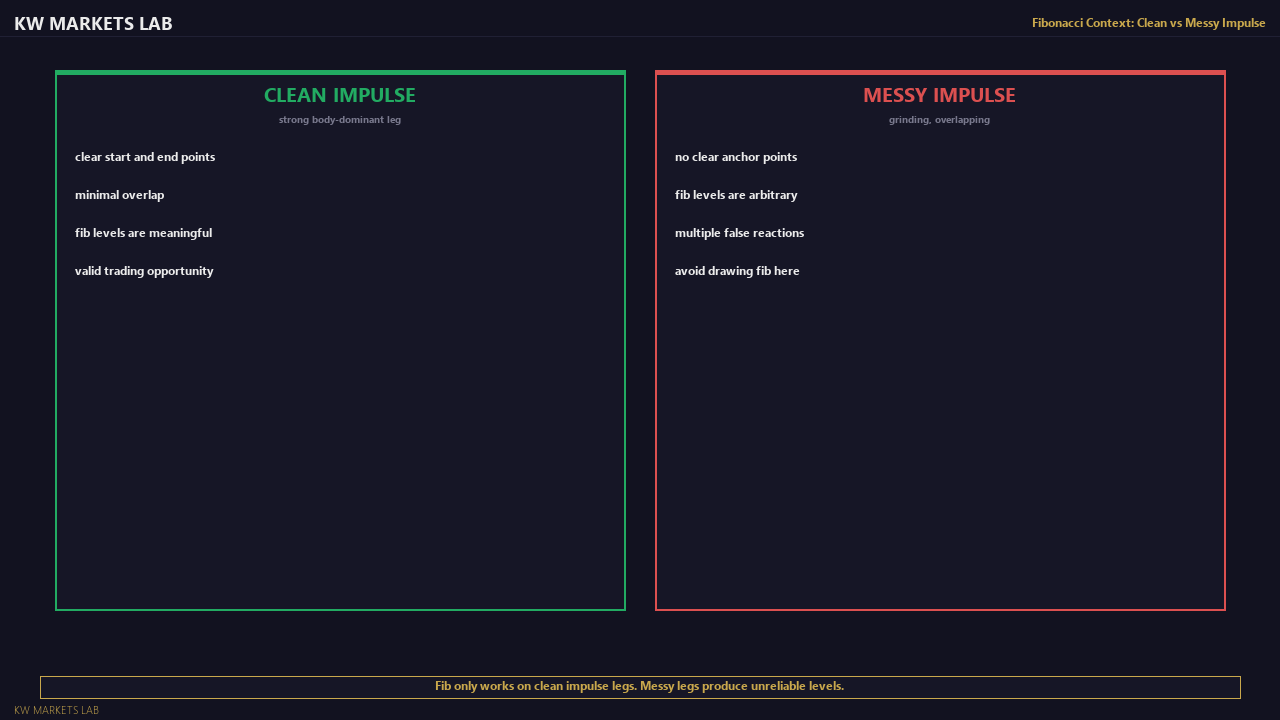
- The impulse was messy with overlapping candles. Clean, impulsive legs produce reliable retracement zones. Overlapping, corrective legs do not.
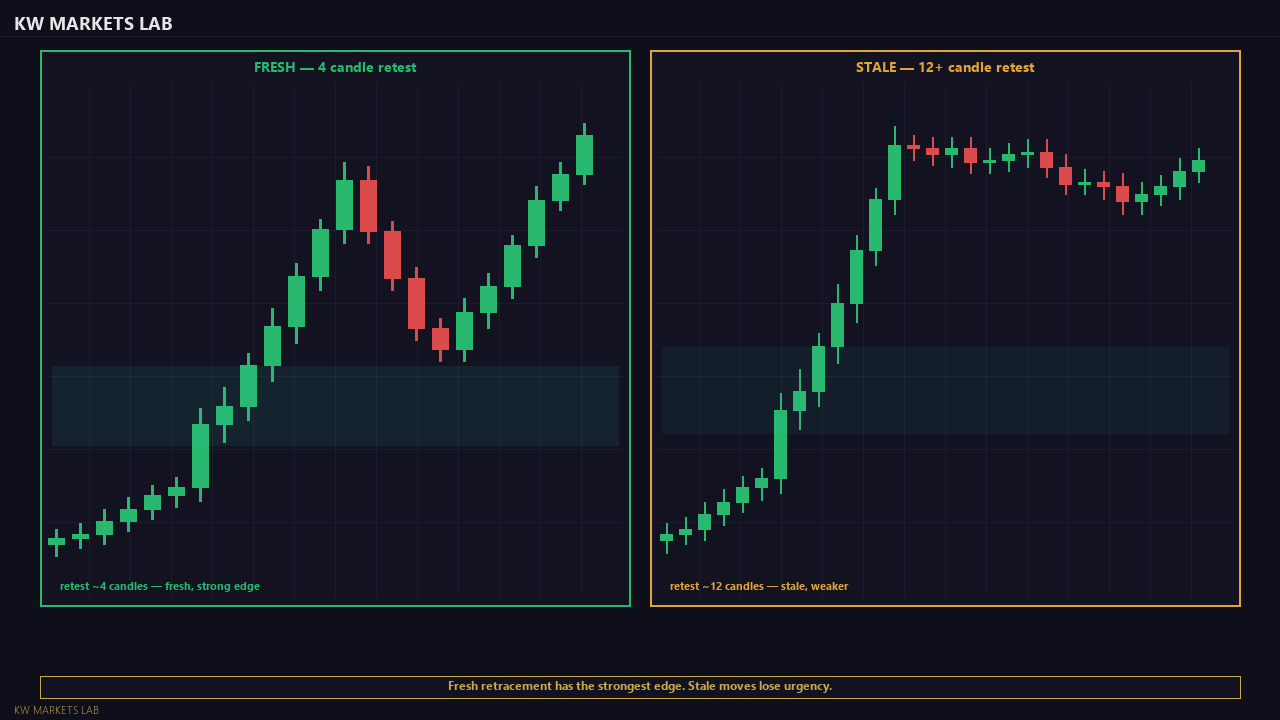
- The retracement is taking too long. If 10+ H4 candles have passed since the impulse ended and price has not reached the retracement zone, the setup is stale.
Common Beginner Mistake
Drawing Fibonacci on every move and treating every level as a trade. Beginners anchor the tool on minor swings and take entries at naked 61.8% levels with no confluence. The result: random entries at arbitrary lines.
The fix: the Fibonacci tool is a confluence filter, not a standalone entry model. Only draw it on significant, completed impulse legs. Only trade when the level aligns with a structural level. No confluence = no trade.
What Experienced Traders Notice
- Whether the impulse was the first leg of a new trend or a late-trend extension. The first retracement of a new trend is the highest probability. The third retracement of a mature trend has lower reliability.
- The depth of the initial retracement. If price retraces to 38.2% and bounces sharply, the trend is strong. If price falls through 50% and stalls near 61.8%, the trend is weaker. If price reaches 78.6%, the impulse is likely being reversed.
- Cluster zones. When multiple Fibonacci levels from different timeframe impulses converge at the same price (a Fibonacci cluster), the zone is particularly strong.
- Time at the level. A clean touch-and-bounce (1-2 candles) is stronger than price sitting at the level for 5+ candles (absorption vs rejection).
When to Skip This Trade
- No structural confluence at the 50% or 61.8% level
- The impulse was driven by a single news candle
- The impulse leg is too short for meaningful retracement levels
- Price has already reached the 78.6% level — the impulse is being reversed
- The retracement has taken 10+ candles without reaching the zone (stale setup)
- The market is ranging — no impulse exists to retrace
Entry Conditions
All conditions must be confirmed before considering an entry at a Fibonacci confluence zone.
1. Trending Structure Confirmed
The D1 or H4 chart must show clear trending structure (HH/HL for bullish, LH/LL for bearish). If the structure is ranging or ambiguous, Fibonacci retracement does not apply — there is no impulse leg to retrace.
2. Clear Impulse Leg Identified
The retracement is measured from a completed impulse leg. For bullish setups: the swing low to the swing high of the most recent completed upward move. For bearish: swing high to swing low. The impulse leg must be clearly the dominant move — not a minor internal swing.
3. Fibonacci Tool Drawn Correctly
Draw the tool from the START of the impulse to the END. For bullish: anchor at the swing low, extend to the swing high. The 61.8% level should be closer to the swing low (deeper retracement). If your 38.2% appears below the 61.8%, the tool is drawn backwards.
4. Confluence Exists at 50% or 61.8%
At least one additional factor must align with the 50% or 61.8% retracement level:
- Prior swing point within 10-15 pips of the Fibonacci level
- Demand/supply zone from a higher timeframe overlapping the Fibonacci zone
- Round number within 10-15 pips
If no confluence exists, the Fibonacci level alone is not sufficient for this strategy.
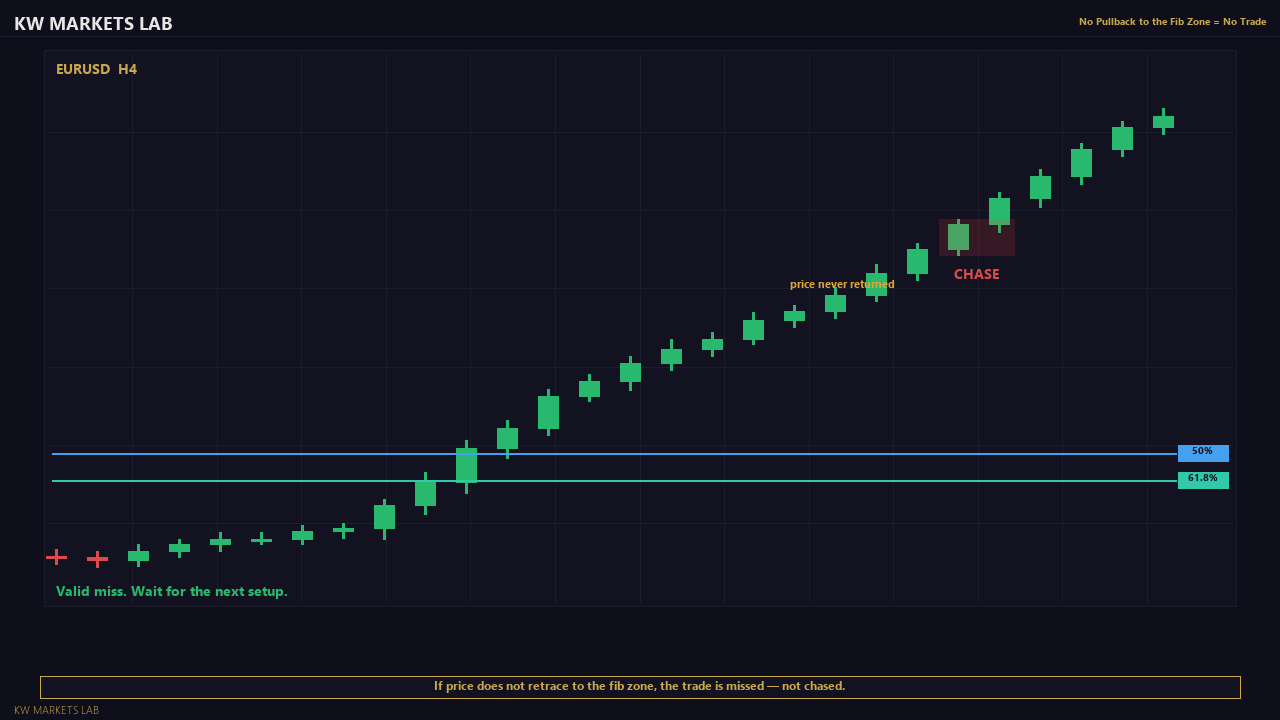
5. Price Reaches the Confluence Zone
Price must actually pull back to the identified zone. Do not anticipate — wait for price to arrive. Many impulse legs do not retrace at all (price continues without pulling back). If this happens, the trade is missed. Do not chase.
6. Confirmation at the Zone
When price reaches the confluence zone, look for:
- Rejection candle (60%+ wick ratio, body closing back in the direction of the trend)
- H1 BOS in the trend direction at the zone
- Strong close off the level after a clean touch
Without confirmation, do not enter. A touch of the zone alone is not a trade.
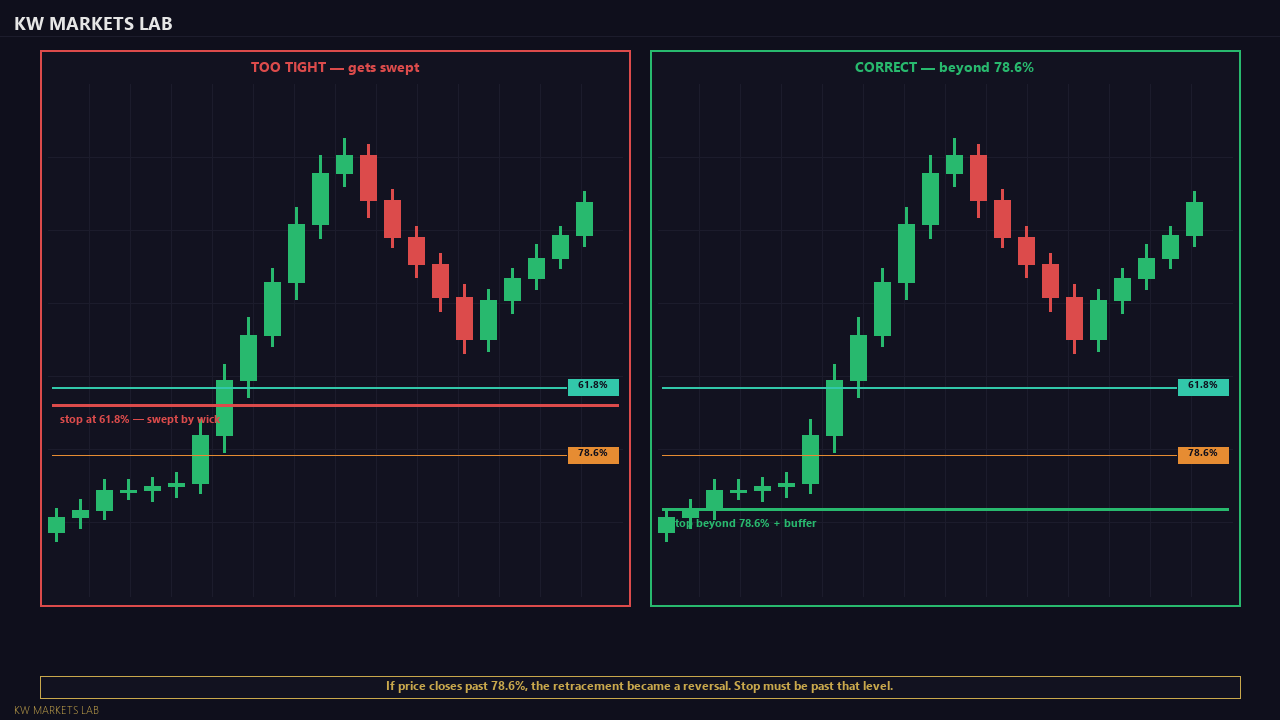
7. Stop Placement
Place the stop beyond the 78.6% retracement level + a buffer (10-20 pips for forex, 50-80 pips for gold). If price retraces beyond 78.6%, the impulse leg is being structurally reversed — the setup is invalid.
8. Target
Primary target: the swing high/low that defines the end of the impulse leg (the 0% retracement level — where the move started before pulling back). Secondary target: the next structural level beyond the impulse extremity. Minimum R:R: 1.5:1.
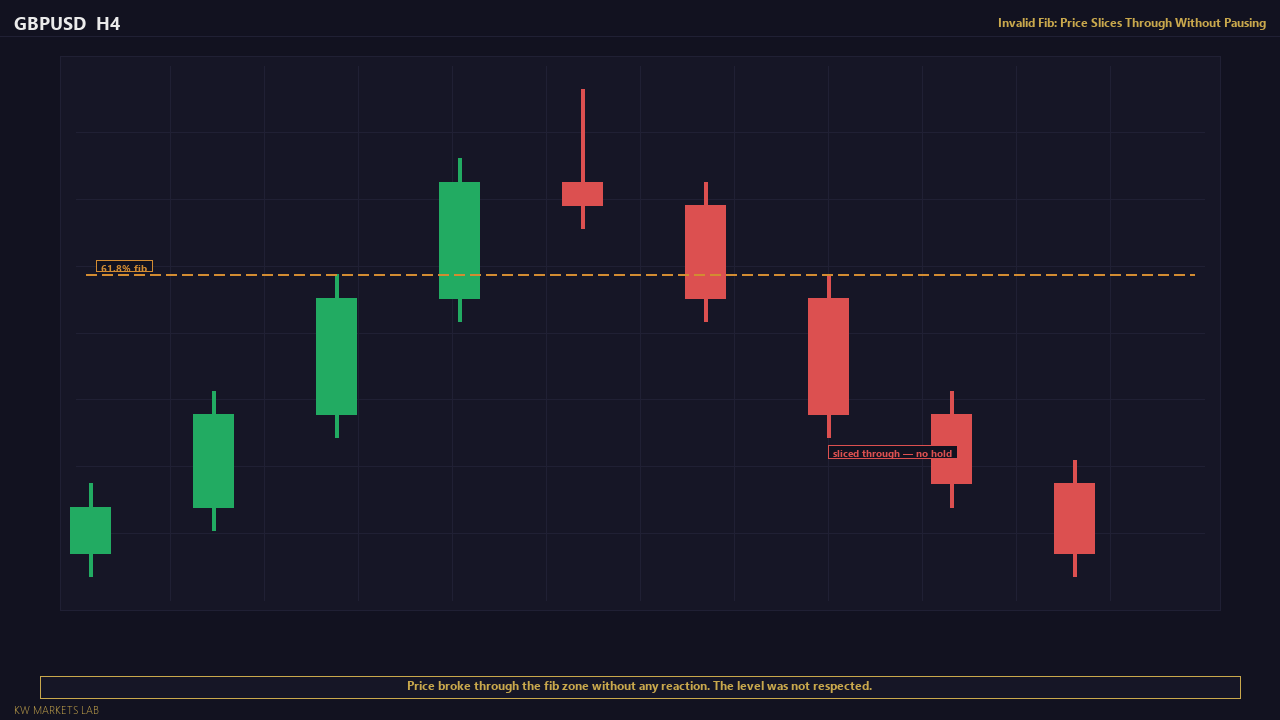
Failed Setup Example
GBPUSD H4 impulse from 1.2600 to 1.2680 (80 pips). 50% retracement = 1.2640. 61.8% = 1.2631. No prior swing, demand zone, or round number exists near 1.2640. A beginner enters long at 1.2642 with a stop below 78.6% (1.2617).
Why this fails: the 50% level sits in empty price space — no structural confluence. The trade is based on a naked Fibonacci level, which has no proven statistical edge. Price drops through 1.2640, through 1.2631, through 78.6%, and continues to 1.2590. The impulse is fully reversed. A confluent setup would have required a prior swing point or demand zone within 10-15 pips of the Fibonacci level.
Invalidation & Risk Rules
When the Fibonacci confluence setup is invalidated.
1. Price Closes Beyond the 78.6% Level
If a candle body closes beyond the 78.6% retracement, the pullback has become a reversal. The impulse leg is being unwound. Close any position and reassess structure. The trend may still be intact on the higher timeframe, but this particular impulse leg's retracement has failed.
2. No Confluence at the Key Levels
If the 50% and 61.8% retracement levels do not align with any structural level, round number, or demand/supply zone, the setup does not meet the confluence requirement. A naked Fibonacci level is not tradeable under this strategy.
3. Structure Changes While Waiting for Retracement
If the trending structure (HH/HL or LH/LL) changes before price reaches the retracement zone — for example, a CHoCH occurs on the H4 — the setup is invalidated. The structural context that justified the trade no longer exists.
4. Retracement Takes Too Long
If the pullback toward the Fibonacci zone takes more than 10-15 H4 candles (2-3 trading days) without reaching the zone, the setup is stale. Price action has moved on, and the impulse leg is no longer the dominant structural feature. Remove the Fibonacci tool and look for a new impulse.
5. News Event at the Retracement Zone
If price reaches the Fibonacci confluence zone within 30 minutes of a high-impact news event, the reaction at the zone will be driven by news — not by the structural confluence. Skip the trade and wait for post-news price action to settle.
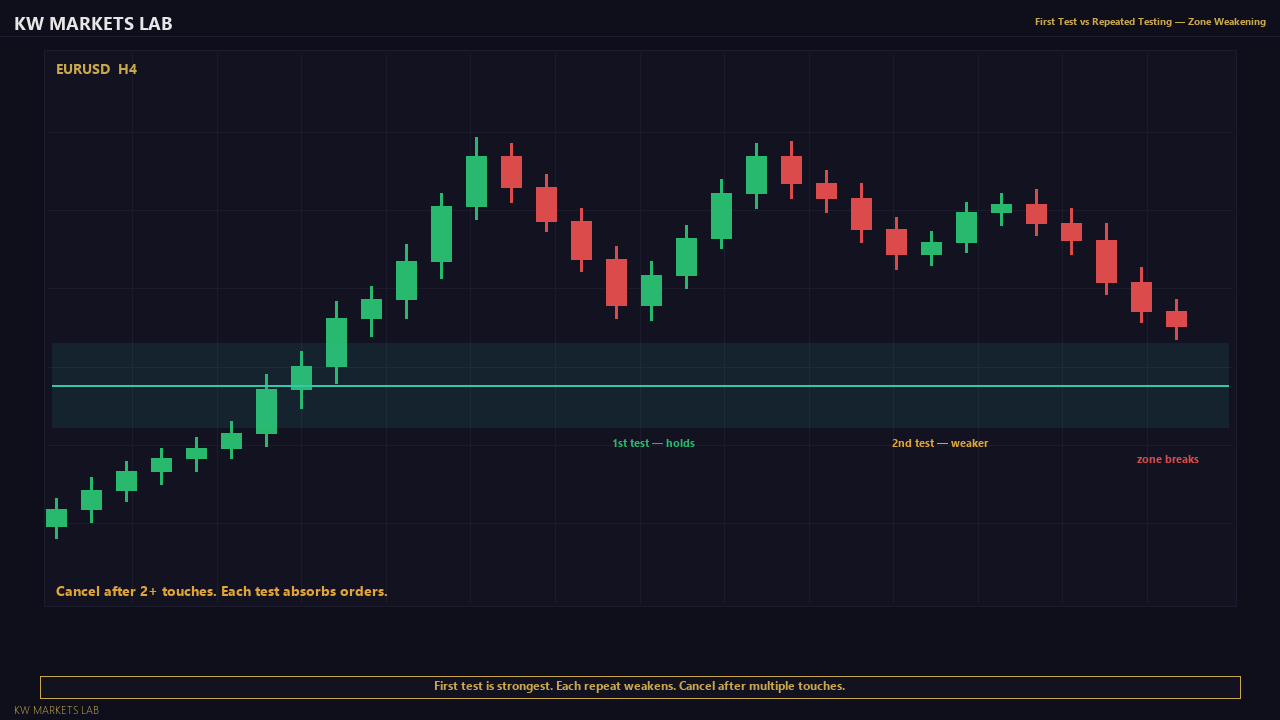
6. Multiple Tests of the Zone
If price reaches the Fibonacci zone, bounces slightly, then returns to test it again, the zone is weakening. A strong confluence zone holds on the first test. After two tests, the probability of a break through increases. Cancel the setup after the second test.
The "Fibonacci Says So" Trap
The most dangerous Fibonacci mistake: believing the level will hold simply because it is a Fibonacci number. Fibonacci levels are not magic. They work when they coincide with real structural evidence (prior swing, demand zone, round number). Without confluence, they are arbitrary horizontal lines. If your only reason for the trade is "it's at the 61.8%," you do not have a setup — you have a guess.
Where It Works
-
Clean trending markets with well-defined impulse legs: EURUSD, GBPUSD, USDJPY during clear trending phases. The cleaner the impulse, the more reliable the retracement.
-
H4 and Daily timeframes: The impulse legs on these timeframes are significant enough to attract institutional interest at the retracement levels. M15 and below produce too many overlapping impulses.
-
When the 50% or 61.8% level aligns with a prior swing point: This is the highest-probability variant. A prior swing high/low at the same price as a Fibonacci retracement creates a dual-reason zone.
-
Post-breakout retracements: After a clear breakout from consolidation, the first pullback to the 50-61.8% zone of the breakout leg is often the cleanest retracement trade.
-
Gold (XAUUSD) with round-number confluence: Gold respects round $10 and $50 levels. When a Fibonacci retracement coincides with a round number on gold, the confluence is particularly strong.
Where It Fails
-
Ranging markets: In ranges, there is no impulse leg. Drawing Fibonacci on overlapping price action produces meaningless levels. If the structure is not trending, do not use this tool.
-
Very short impulse legs: If the swing high to swing low is only 30-40 pips on forex, the retracement levels are only 15-25 pips apart. The zones are too narrow to be meaningful, and stop placement becomes impractical.
-
News-driven impulse legs: An impulse caused by a single news candle may produce a sharp move, but the retracement behaviour is often erratic because the move was driven by repricing rather than structural participation.
-
Late-trend impulses: The third or fourth impulse leg in a trend is more likely to be followed by a reversal rather than a clean retracement. The deeper the trend, the less reliable each new impulse's Fibonacci retracement becomes.
-
When no confluence exists: A Fibonacci level with no supporting structural evidence is not a trade under this strategy. Many traders lose money applying Fibonacci without the confluence filter.
Known Limitations
-
Fibonacci levels are subjective because the impulse leg endpoints (swing high and swing low) are chosen by the trader. Different practitioners may draw slightly different retracements on the same chart.
-
The tool works best on clear, clean impulse legs. Messy, overlapping price action produces unreliable retracement levels because the start and end of the impulse are ambiguous.
-
Fibonacci retracement alone has no proven statistical edge. Its value comes entirely from confluence — when combined with structural levels, the zone gains order density. Without confluence, Fibonacci levels are no better than arbitrary lines.
-
The 38.2% level is frequently overshot. The 61.8% level is frequently not reached. There is no guarantee that price will retrace to any specific level.
-
In very strong trends, price may not retrace at all — it continues making new highs/lows without pulling back to the key Fibonacci levels. This means missed trades, not failed analysis.
-
The strategy requires patience. Pulling back to the 50% or 61.8% level may take hours or days. If you need frequent activity, this strategy will frustrate you.
Evidence & References
Murphy covers Fibonacci retracements as a standard tool in technical analysis. He emphasises the 38.2%, 50%, and 61.8% levels as the primary retracement zones of interest and notes that these levels function best as areas of potential support or resistance rather than precise entry points. The confluence requirement in this framework directly reflects this guidance.
Murphy, John J. Technical Analysis of the Financial Markets. NYIF, 1999.
The partial self-fulfilling nature of Fibonacci levels is a well-documented phenomenon. When large numbers of participants watch the same levels, their collective behaviour at those levels contributes to the observed reactions. This is not a "secret" — it is a structural feature of technical analysis tools with wide adoption. The implication for this framework: Fibonacci levels on major pairs with high participation are more reliable than on minor or exotic pairs.
Practitioner literature — widely referenced in technical analysis communities.
Research Notes
Mathematical and practitioner references.
The Fibonacci sequence (0, 1, 1, 2, 3, 5, 8, 13, 21...) produces ratios (61.8%, 38.2%, 23.6%) that appear in natural phenomena. Their application to financial markets is attributed to Ralph Nelson Elliott (1930s) and later popularised by Robert Fischer, Constance Brown, and others.
References:
- Fischer, R. (1993). Fibonacci Applications and Strategies for Traders. Wiley. Systematic treatment of Fibonacci retracement and extension in trading.
- Brown, C. (2008). Fibonacci Analysis. Bloomberg Press. Advanced Fibonacci concepts including confluence and cluster analysis.
- Murphy, J. (1999). Technical Analysis of the Financial Markets. NYIF. Chapter on Fibonacci retracement as a standard technical tool.
- Brooks, A. (2012). Trading Price Action Trends. Wiley. Documents pullback entry methodology consistent with retracement-based entries.
Important context:
Studies on Fibonacci levels in isolation (without confluence) have not demonstrated statistically significant predictive power. The value of Fibonacci in this strategy comes from its role as a confluence tool — identifying zones where multiple factors align. Your own trade log, tracked over 30+ setups with and without confluence, is the best test of whether this approach works for your execution.
Learn the Full Framework
The concepts behind this strategy are covered in the Foundations course.
Start the Course →Full Documentation
Annotated examples, failure breakdowns, and complete evidence.
View VIP Access →