Overview
A framework for identifying and trading with prevailing market structure using swing high and swing low analysis. Teaches traders to distinguish trending from ranging conditions before committing to a directional trade.
Before using this strategy:
When to Use This Strategy
- ✓Before any trade: use this to determine directional bias
- ✓Daily and H4 timeframes with clear swing sequences
- ✓Major forex pairs or gold with institutional participation
- ✓As the first step in your pre-session analysis routine
When NOT to Use It
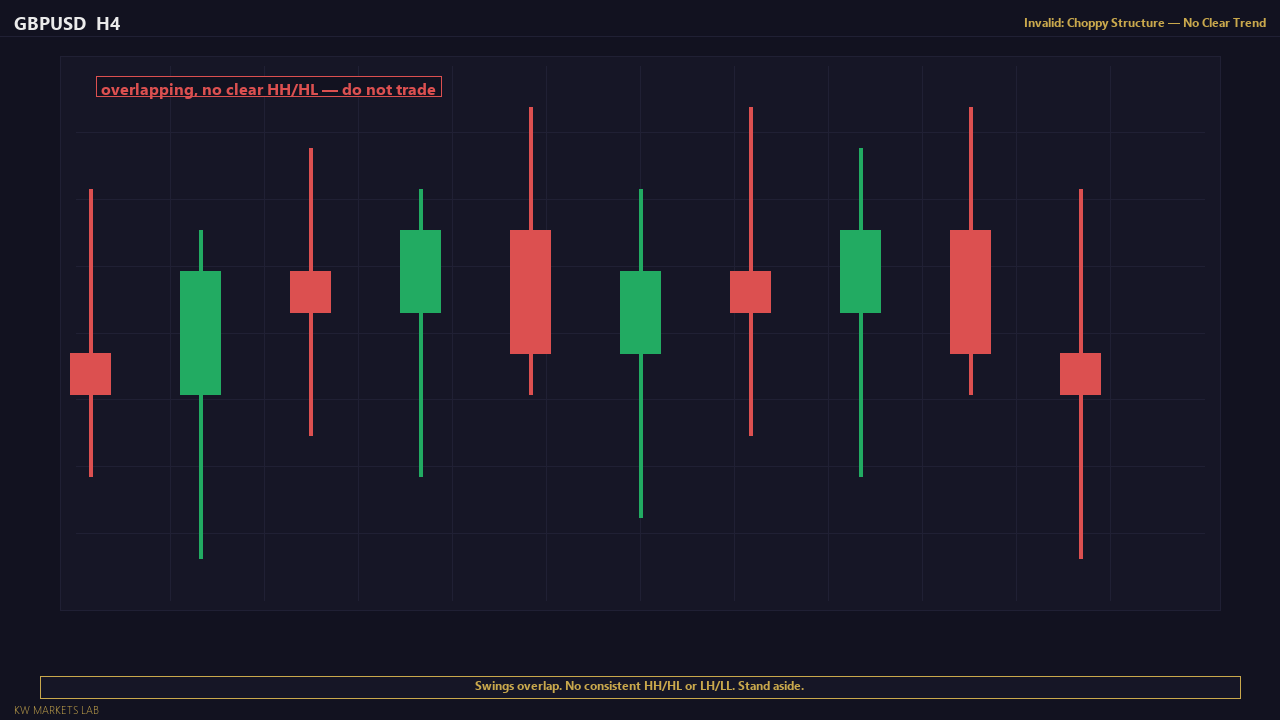
- ✗Choppy, overlapping price action with no clear swing sequence
- ✗During or immediately after high-impact news events
- ✗On M15 or lower timeframes where structure shifts too rapidly
- ✗When you cannot clearly classify the state as bullish, bearish, or ranging
Framework Overview
Market structure is the foundation of all price action analysis. Before you can identify a setup, before you can define a bias, before you can place a trade — you must be able to read the structural state of the market. This strategy teaches you to do exactly that.
What Market Structure Is
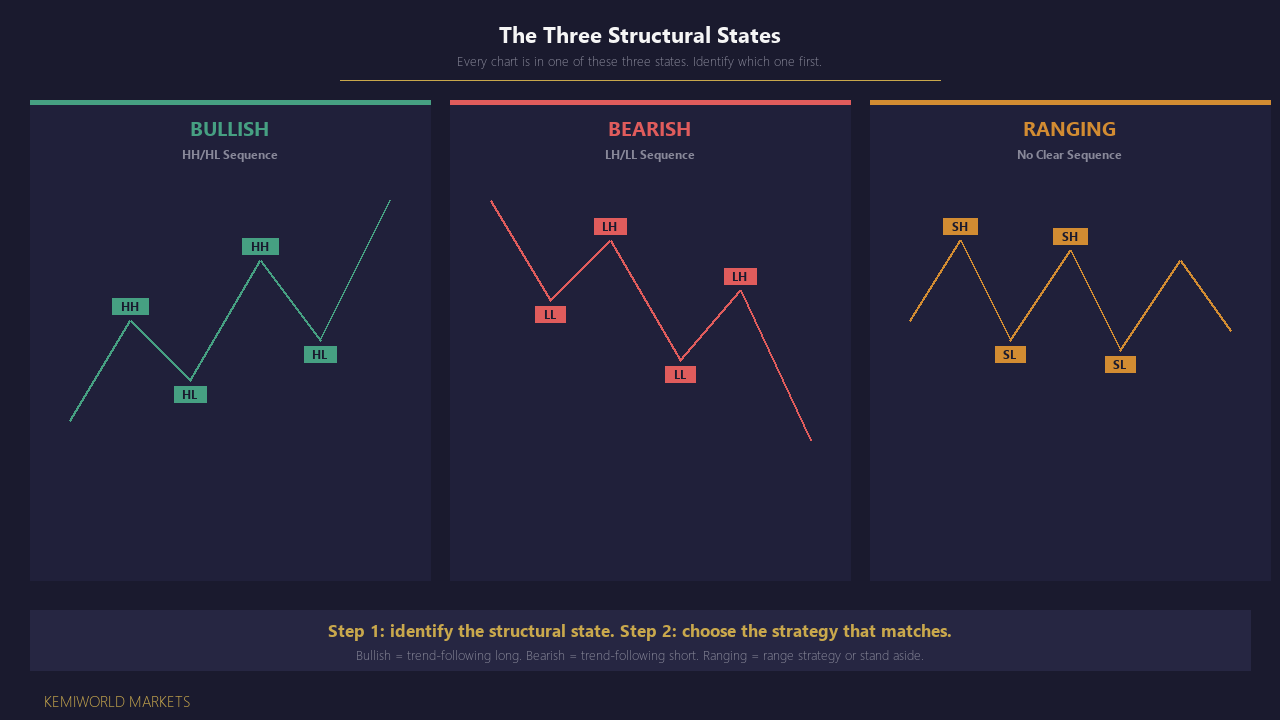
Market structure is the pattern of swing highs and swing lows that price creates as it moves through time. Every chart, on every timeframe, is a sequence of these swing points. By reading the sequence, you determine the structural state:
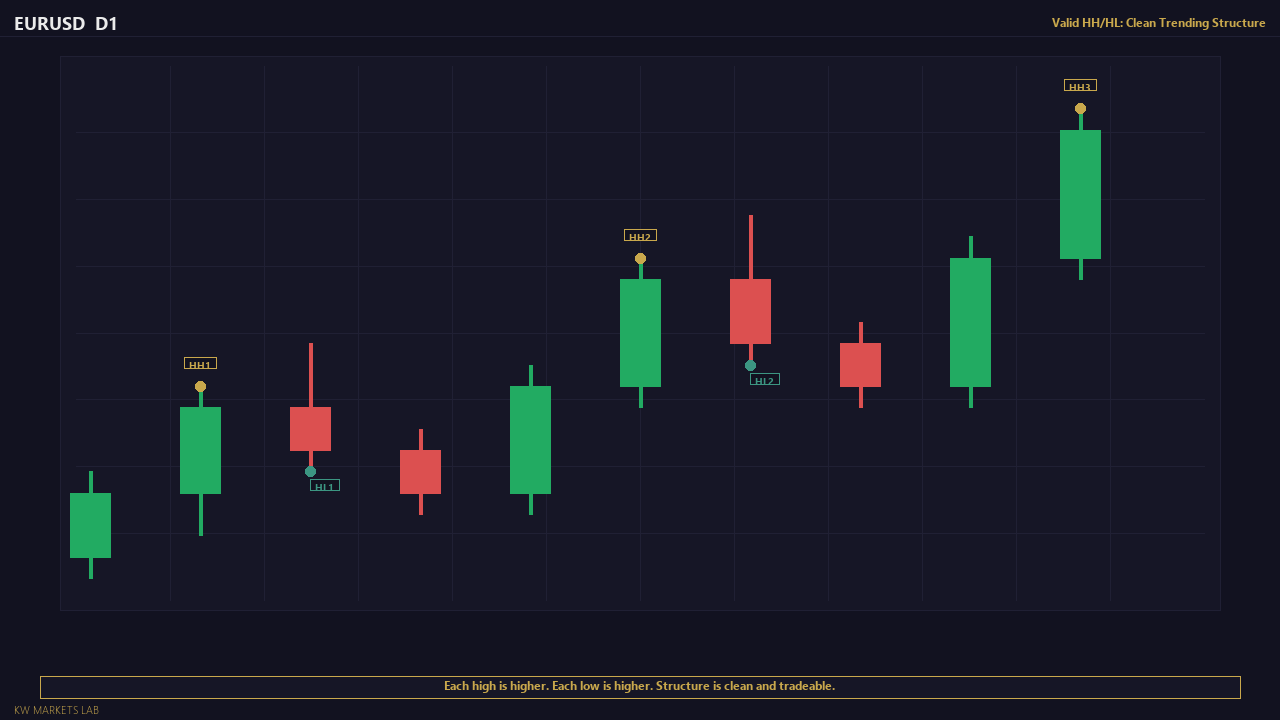
- Bullish structure: price makes higher highs (HH) and higher lows (HL). Each successive peak is above the prior peak, and each successive trough is above the prior trough. This is an uptrend.
- Bearish structure: price makes lower highs (LH) and lower lows (LL). Each successive peak is below the prior peak, and each successive trough is below the prior trough. This is a downtrend.
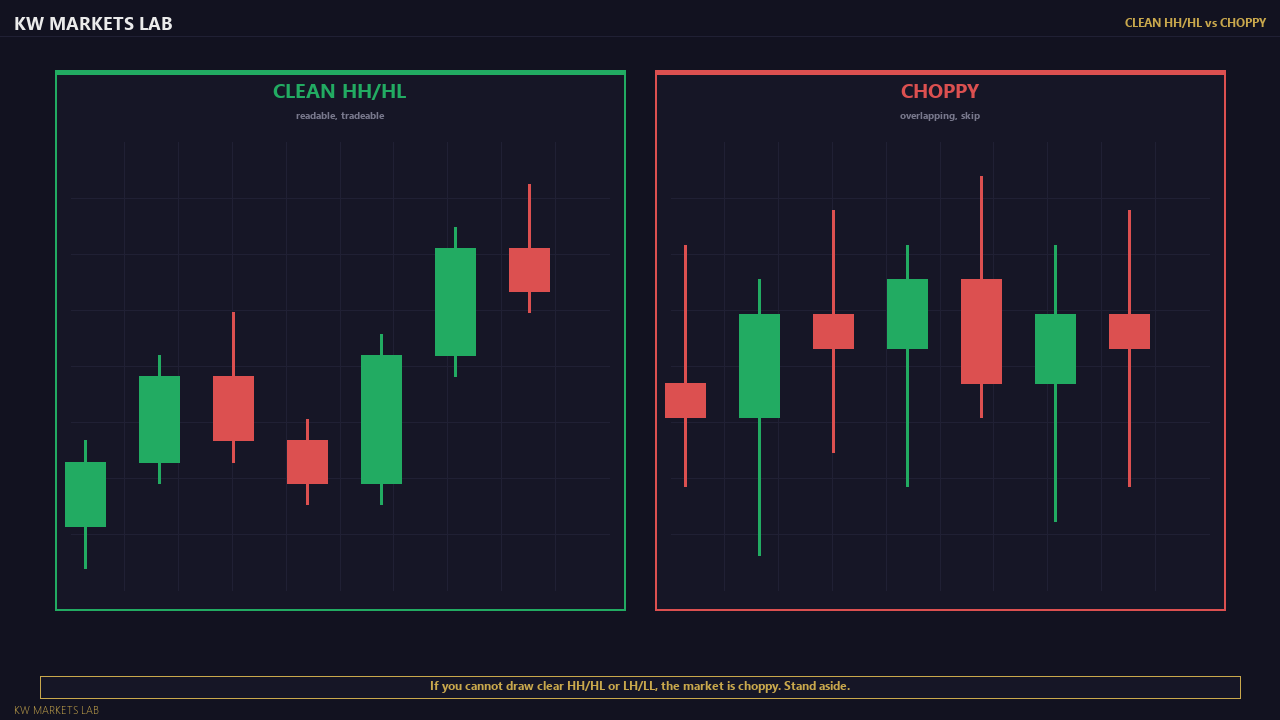
- Ranging structure: swing highs and swing lows overlap without making consistent higher or lower extremes. There is no directional commitment. This is a consolidation.
The first decision on any chart is always: which structural state am I in? Everything else follows from this answer.
Why This Framework Matters
The structural state determines which strategies are valid. A trend-following strategy (like BOS continuation) requires trending structure. A range strategy requires ranging structure. Applying the wrong strategy type to the wrong structural state is the most common source of unnecessary losses.
This is not a prediction framework. It does not tell you where price will go. It tells you what price has done — and from that, you can determine which setups are structurally valid in the current context.
How to Identify Swing Points
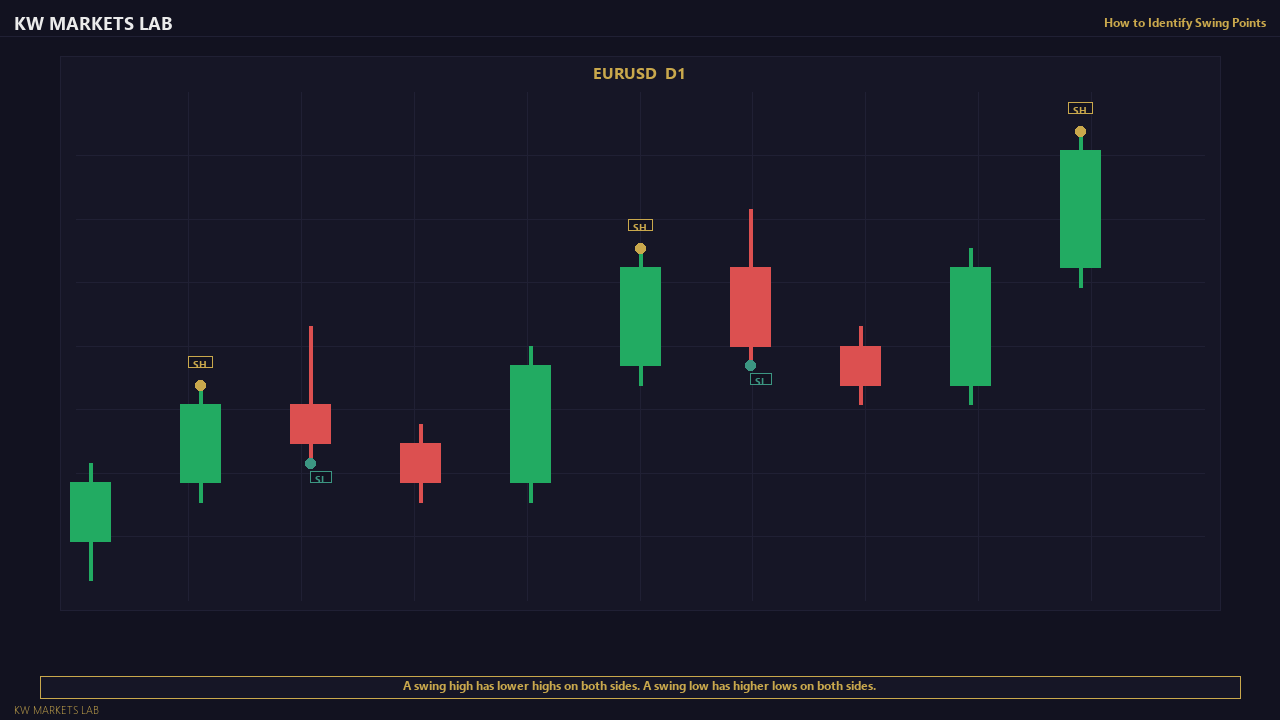
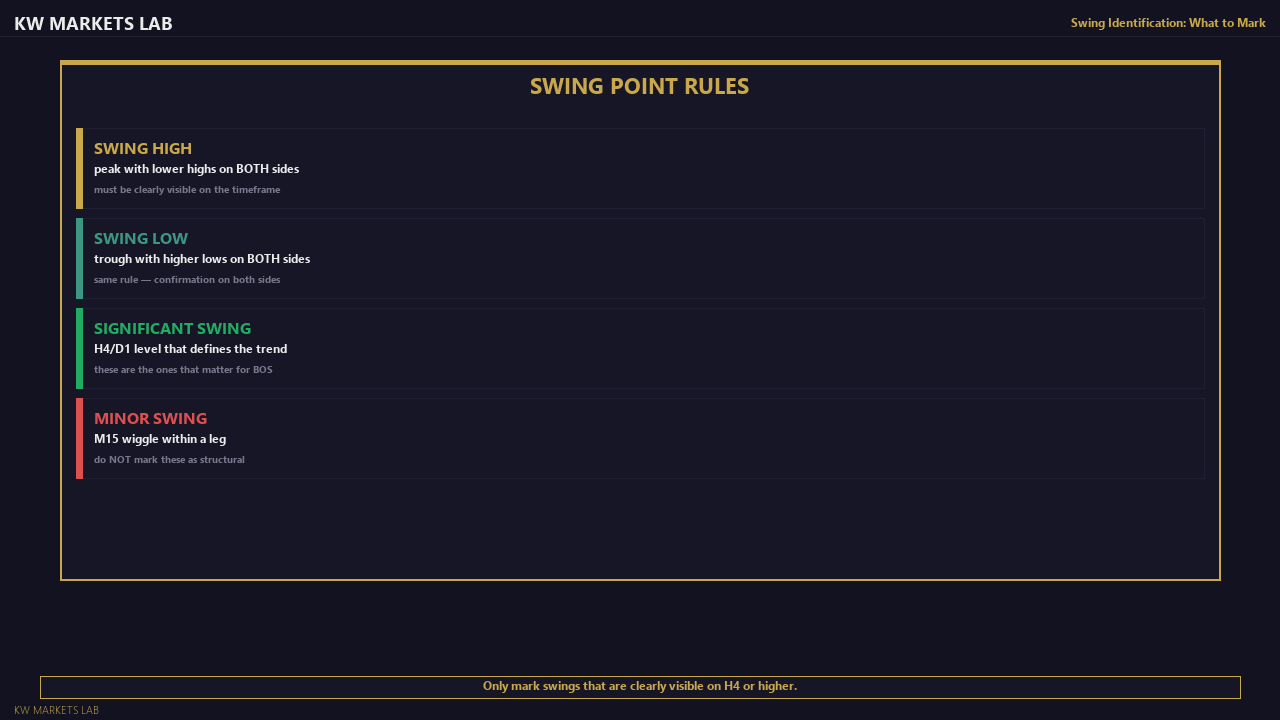
A swing high is a candle whose high is higher than the highs of the candles immediately before and after it. A swing low is a candle whose low is lower than the lows of the candles immediately before and after it. The simplest definition requires just one candle on each side (a 3-candle formation), but in practice, more significant swings are identified by requiring 2-3 candles on each side.
The key principle: you are not looking for every minor wiggle. You are looking for the significant structural turning points that define the trend's skeleton. If a swing point is not visible at a glance on the chart, it is probably an internal (minor) swing — not an external (structural) swing.
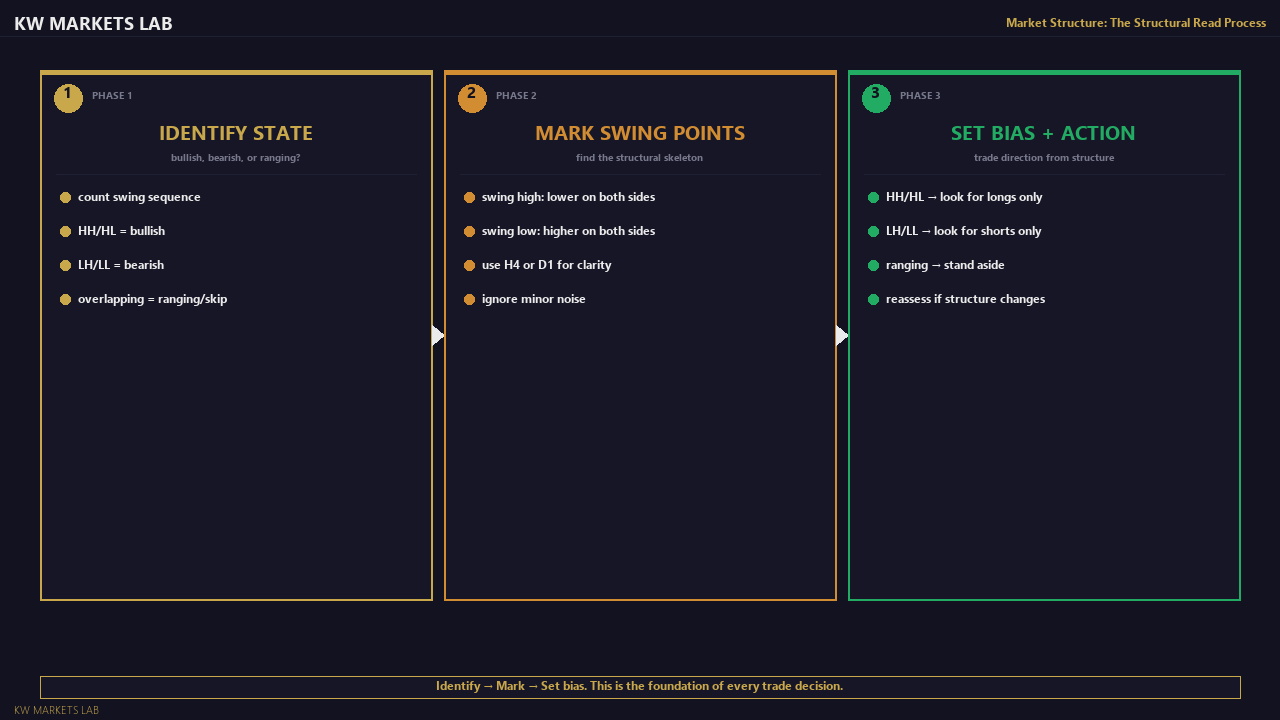
The Structural Read Process
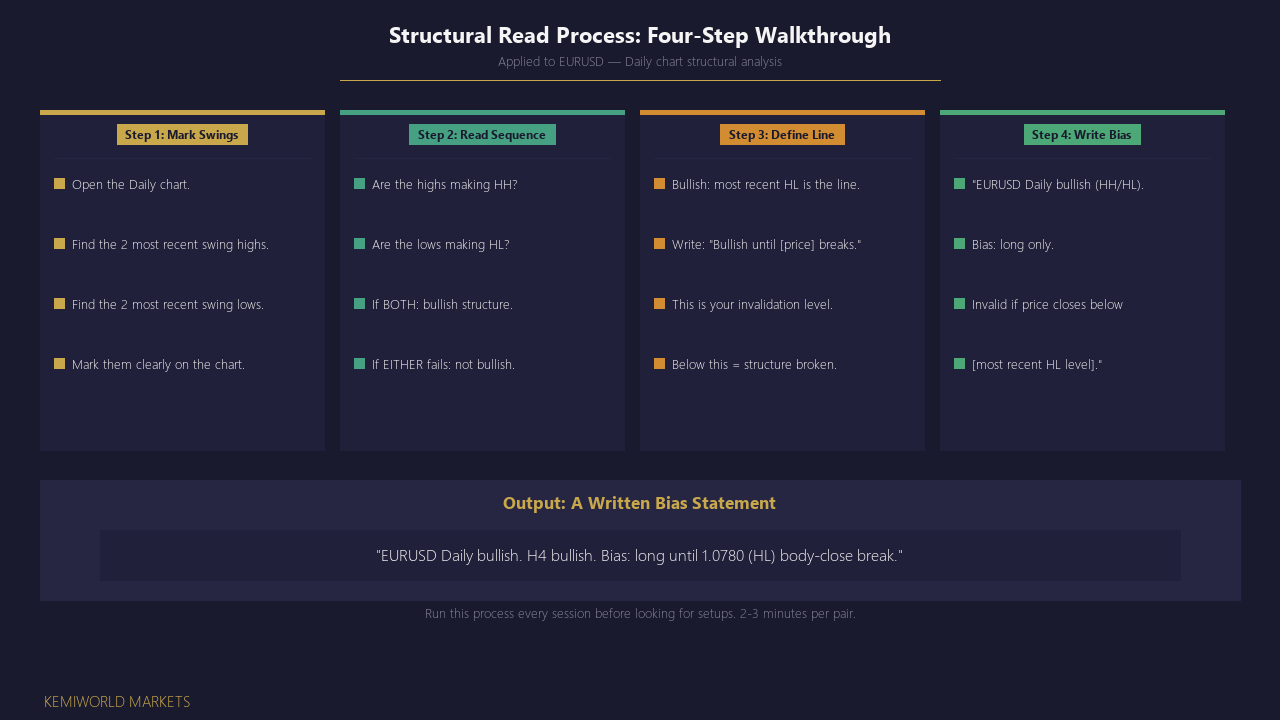
- Open the Daily chart. Identify the two most recent swing highs and two most recent swing lows.
- Determine the sequence: are the highs making HH? Are the lows making HL? If both: bullish. If LH and LL: bearish. If mixed: ranging.
- Move to H4. Repeat the same process. The H4 read should broadly agree with the Daily. If it contradicts, the market is in transition — stand aside.
- Write a one-sentence bias statement: "Daily bullish, H4 bullish, bias is long until [specific invalidation level] is broken."
What This Strategy Is Not
This is not a standalone entry model. It is a context framework. It tells you which direction to look for trades, not where to enter. Combine this with an entry model (BOS continuation, rejection at structure, etc.) for complete trade execution.
Market Conditions Required
Structural analysis requires settled price action. Do not attempt structural reads when:
- A high-impact news event occurred within the last 3 H4 candles. Structure can be temporarily distorted by repricing. Wait for the market to settle.
- The instrument has been in a tight range for 3+ weeks with overlapping swings. In this state, the structural read is "ranging" — and the correct action is to wait, not to force a directional read.
- You are looking at M15 or lower. Structure shifts too rapidly on short timeframes. The framework is designed for Daily and H4.
What Makes This Read Weak

- Only one HH or one LL is present — that is one data point, not a confirmed sequence. You need two consecutive pairs to establish the pattern.
- The swing points overlap. If HH2 is barely above HH1 (3-5 pips on forex), the trend is running out of momentum. Clean trends have well-separated swing points.
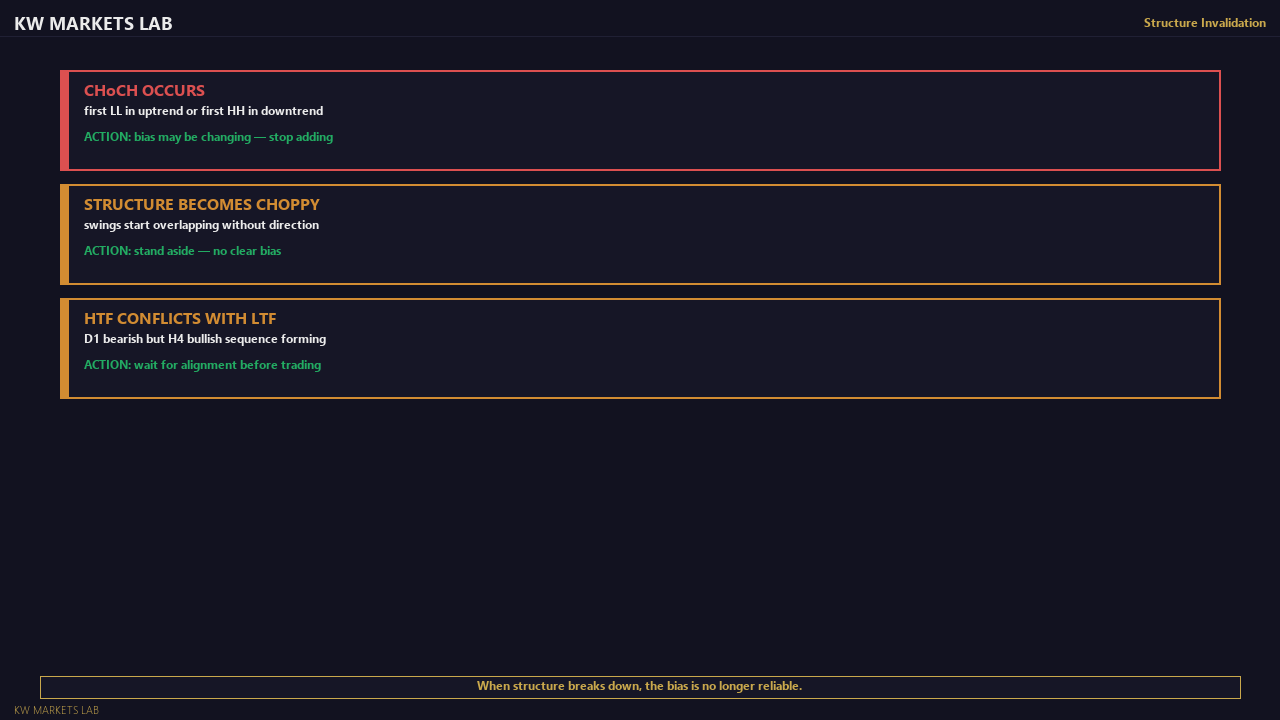
- The Daily and H4 disagree. If Daily is bullish but H4 is making LH/LL, the market is in transition. The correct action is to wait for alignment, not to pick a side.
Common Beginner Mistake
Trying to force a directional read on every chart, every day. Some days the structure is genuinely ambiguous — and that ambiguity IS the correct read. Beginners feel pressure to have an opinion. Experienced traders accept "I don't know" as a valid structural state and move to a different pair.
The second mistake: updating the structural read during or immediately after a news event. A single CPI candle can create a new swing high AND a new swing low in the same session. Wait for 2-3 H4 candles of post-news action before updating your read.
What Experienced Traders Notice
- The quality of the swing points. A swing high that was tested 3 times before breaking is a far more significant structural marker than one that formed on a single candle and was immediately passed.
- Whether the lows are rising as fast as the highs. In a healthy uptrend, both HH and HL are well-separated. When HH continues rising but HL flattens, momentum is weakening — a pre-CHoCH warning.
- The slope of the trend. Steep trends (sharp HH/HL) are more likely to produce sudden reversals. Shallow, steady trends persist longer.
- How the current structure relates to Weekly/Monthly levels. A bullish D1 structure approaching Monthly resistance is a cautionary context — the structure may be correct but the risk is elevated.
When This Framework Does Not Apply
- Ranging markets with overlapping swings — the read is "ranging" but there is no directional trade
- During active news repricing (wait for settlement)
- On M15 and lower timeframes where structure changes too frequently
- When you cannot identify at least two swing pairs — insufficient data to confirm a trend
Entry Conditions
Conditions for establishing a valid structural read — all must be confirmed before taking directional trades.
1. Two Confirmed Swing Highs and Two Confirmed Swing Lows
A valid structural read requires at least two consecutive swing highs and two consecutive swing lows on the chosen timeframe. A single HH does not confirm bullish structure — you need HH + HL as a pair, and ideally two pairs to confirm the sequence.
Why two? One swing point could be noise. Two consecutive swing points making higher/higher (or lower/lower) establishes a pattern that is more likely to continue.
2. Sequence Must Be Unambiguous
Bullish structure: HH1 above HH0 AND HL1 above HL0. Both conditions must be true. If the highs are making HH but the lows are making LL (or equal lows), the structure is ambiguous — it is not a clean trend. Do not trade ambiguous structure.
Bearish structure: the mirror. LH1 below LH0 AND LL1 below LL0. Both conditions.
3. Timeframe Alignment (Recommended)
For highest-probability reads, the Daily and H4 structural states should agree. If Daily is bullish and H4 is also bullish, you have alignment — look for long setups with confidence. If Daily is bullish but H4 is bearish, the market may be pulling back within a larger uptrend. This is a valid context for a pullback entry — but you need to be aware that the immediate H4 momentum is against your Daily bias.
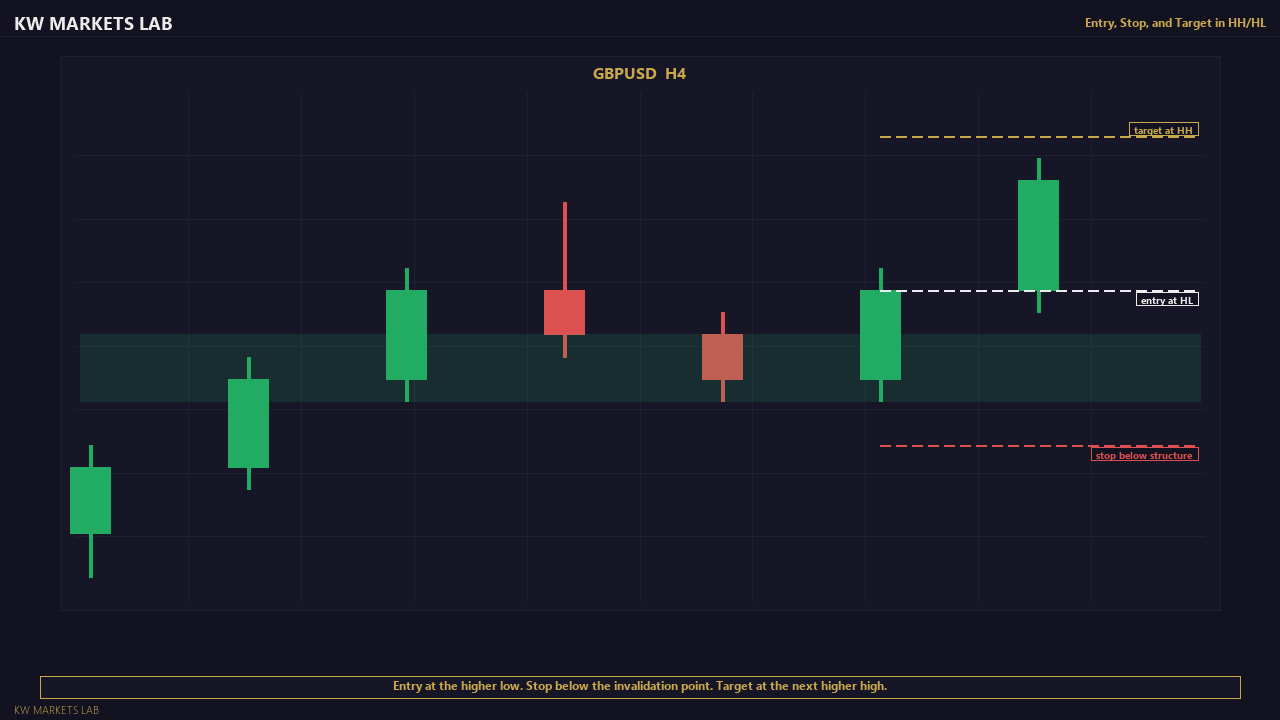
4. The Most Recent Swing Low (Bullish) or Swing High (Bearish) Is Your Line in the Sand
In bullish structure, the most recent HL is the invalidation point. If price closes below it on the Daily, bullish structure is broken. Define this level explicitly before looking for setups. Write it down.
In bearish structure, the most recent LH is the invalidation point.
5. Clean Swing Points — Not Noise
The swing points you use for the structural read should be clearly visible on the chart. If you have to zoom in significantly to see them, they are minor (internal) swings — not the structural skeleton. Use swings that have been tested or respected by subsequent price action.
6. No Structural Read During Active News Events
Structure can be temporarily distorted by high-impact news (NFP, CPI, FOMC). Do not update your structural read during or immediately after a major news event. Wait for 2-3 H4 candles of post-event price action before reassessing.
Failed Read Example
EURUSD Daily shows HH at 1.0920 and HL at 1.0860. A single candle drops to 1.0845 (below the HL) but closes back at 1.0870. A beginner calls this a CHoCH and flips to bearish bias.
Why this was wrong: the candle wick went below the HL but the body closed above it. A wick-only break is not structural invalidation — it is a liquidity sweep. The structural read remains bullish until a body close below the HL confirms the break. The beginner flipped prematurely and missed the next 80-pip rally.
Invalidation & Risk Rules
When structural reads are invalidated — and what to do.
1. Bullish Invalidation: Close Below the Most Recent Higher Low
If an H4 or Daily candle body closes below the most recent confirmed higher low, bullish structure is broken. This does not automatically make the structure bearish — it may transition to ranging. But it does mean you can no longer assume bullish continuation. Close or flatten any long bias trades.
The key word is "body close." A wick below the HL that recovers and closes above it is a sweep — potentially bullish, not bearish. Only a body close counts as structural invalidation.
2. Bearish Invalidation: Close Above the Most Recent Lower High
The mirror of the bullish rule. If a candle body closes above the most recent LH, bearish structure is no longer valid.
3. Change of Character (CHoCH)
A Change of Character occurs when the structure makes a swing that violates the trend's swing sequence for the first time. In a bullish trend, the first lower low is a CHoCH. In a bearish trend, the first higher high is a CHoCH.
CHoCH is an early warning — not a confirmed reversal. After a CHoCH, the structure may:
- Transition to ranging (most common)
- Reverse into a new trend (less common)
- Produce a false break and resume the original trend (possible)
Do not immediately flip your bias on a CHoCH. Wait for a new sequence of swing points to establish the new structural state.
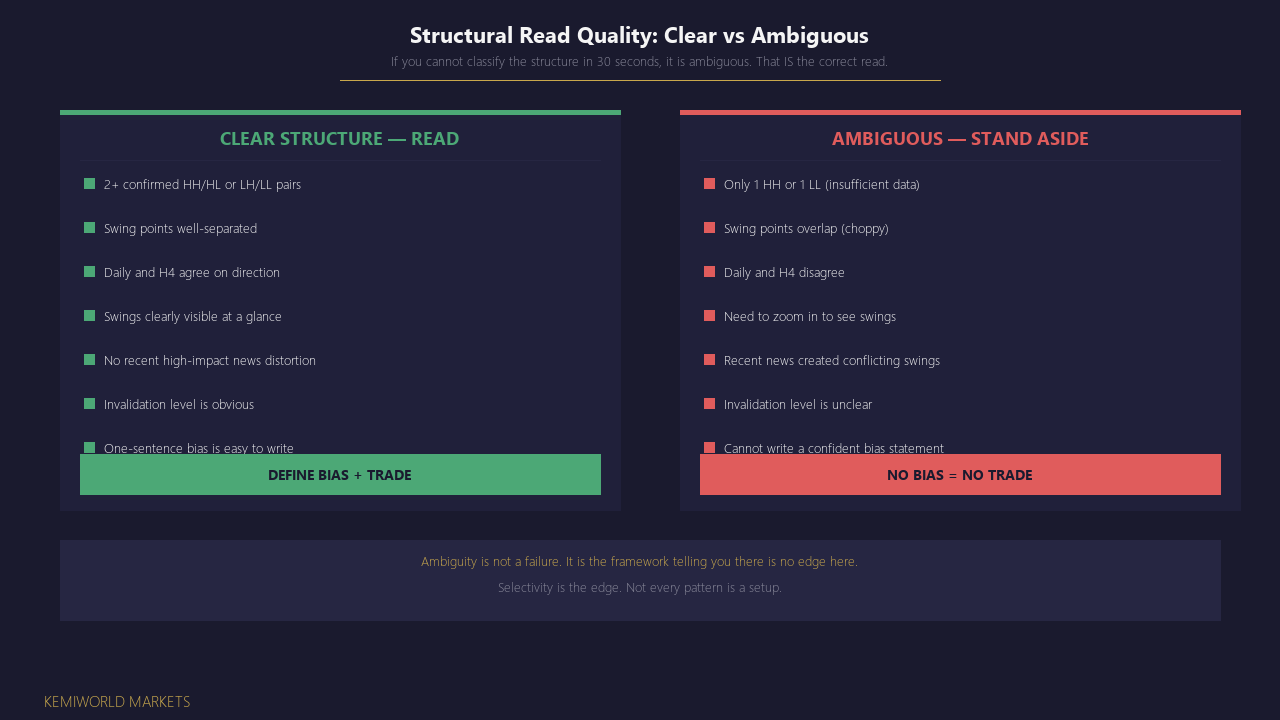
4. Ambiguous Structure = No Trade
If after reviewing the recent swing points you cannot clearly classify the structure as bullish, bearish, or ranging — it is ambiguous. Ambiguous structure means: do not trade this pair on this timeframe. Move to a different pair or wait for clarity.
This is not a failure. It is a filter that prevents you from trading in conditions where your framework has no edge.
5. Structure Broken by a Single Wick
A wick-only break of a swing level is not structural invalidation. Price may sweep below a swing low to trigger stops and then reverse sharply. This is a liquidity event, not a structural event. The structural read only updates when a candle body confirms the break.
Premature CHoCH Call
The most expensive structural mistake: calling a CHoCH on a wick break and flipping bias. After a CHOCH, the structure may transition to ranging (most common), reverse into a new trend (less common), or produce a false break and resume the original trend (also possible). Do not flip bias on the first CHoCH — wait for a new sequence of 2 swing pairs to establish the new direction. One data point is not a pattern.
Where It Works
Conditions where structural analysis provides the clearest directional context.
-
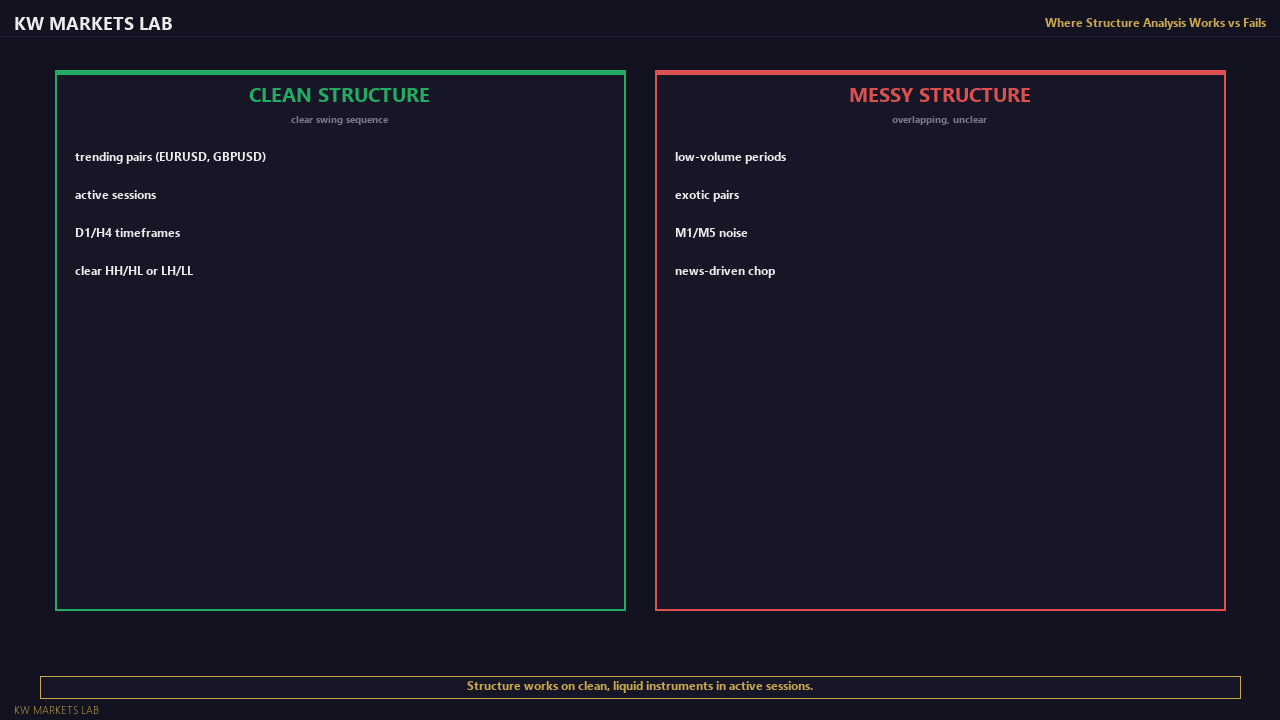
Major forex pairs in trend phases: EURUSD, GBPUSD, USDJPY, AUDUSD during clear directional periods. These pairs produce clean swing sequences with institutional participation supporting the structure.
-
Daily and H4 timeframes: The structural skeleton is most reliable on these timeframes. Daily swing points represent multi-day decisions by large participants. H4 swing points represent intra-day trend phases with meaningful volume behind them.
-
Post-consolidation breakouts: When a pair breaks out of a multi-week range, the initial swing sequence establishes a new structural direction. The first HH/HL pair after a range break is a high-confidence structural read.
-
Pairs with defined macro trends: When a central bank policy divergence is driving a pair directionally, the structural analysis aligns with the fundamental backdrop. The technical structure and the macro context reinforce each other.
-
As a context filter for other strategies: Market structure analysis is most powerful when used as the first step in a multi-step process. Read the structure → determine the valid direction → then apply an entry model (BOS, rejection, etc.).
Where It Fails
Conditions where structural analysis provides unreliable or misleading reads.
-
Choppy, low-volume ranging markets: In tight ranges with overlapping candles, every minor swing looks like a potential structural change. The swing sequence flips frequently and produces false trend reads. The correct action is to identify the range and stop trying to find a trend.
-
News event periods: A single NFP or CPI candle can produce a swing high AND a swing low within the same 5-minute window. Structural analysis requires settled price action — not reactionary spikes. Wait for post-event stabilisation before reading structure.
-
Liquidity sweeps around key levels: Institutional players frequently sweep swing lows (in uptrends) or swing highs (in downtrends) to fill large orders. These sweeps temporarily break the swing sequence and can produce false CHoCH reads. The structural read should update only on body closes, not wick sweeps.
-
Very low timeframes (M5, M1): Structure shifts so rapidly on these timeframes that the structural state may change multiple times per hour. The framework is designed for D1/H4 — it degrades significantly below H1.
-
Pairs with no clear macro driver: Some currency pairs trade in extended, aimless ranges for weeks at a time. Structural analysis will correctly identify the ranging state — but it offers no actionable direction. This is not a failure of the framework; it is the framework working correctly by telling you to stand aside.
-
Correlated pairs: If EURUSD shows bullish structure and DXY shows bearish structure, this is the same trade. Reading structure on both and treating them as independent signals overstates your conviction. Always check for correlation before doubling exposure.
Known Limitations
Honest limitations — understand these before relying on the framework.
-
Swing point identification is subjective. Two traders analysing the same chart may mark slightly different swing highs and lows. This is inherent in all structural analysis. The solution is consistency: choose a method and apply it the same way every session.
-
The structural read is descriptive, not predictive. Knowing that the structure is bullish tells you what has happened — not what will happen. The trend can reverse at any time. The structural read tells you the current context, not the future.
-
Structural analysis works best on higher timeframes (Daily, H4). On M15 and below, the swing sequence changes so frequently that the structural state may shift multiple times per session, producing contradictory reads.
-
In ranging markets, the framework tells you the structure is ranging — but it does not give you a specific trade. You need a separate strategy for ranging conditions (range boundary trades, mean reversion, etc.).
-
Structure can be distorted by low-liquidity periods (Asian session on forex, holiday periods). Swing points formed during thin liquidity are less reliable structural markers.
-
The transition from trending to ranging (and vice versa) is gradual. There is no clean boundary where bullish structure "becomes" ranging. You will sometimes be uncertain — and that uncertainty is correct. It means you should wait.
Visual Examples
Evidence & References
Charles Dow's foundational principle: a trend is defined by a series of successive highs and lows. An uptrend is characterised by higher peaks and higher troughs; a downtrend by lower peaks and lower troughs. Market structure analysis is a direct application of this principle to modern price charts.
Dow, Charles H. (via Wall Street Journal editorials, 1900–1902)
Brooks provides an extensive practitioner framework for reading price structure using swing highs and lows, including how to identify trend legs, pullbacks, and structural breaks. The framework documented here draws on the same conceptual foundation: structure as the context for entries, not the entry itself.
Brooks, Al. Reading Price Charts Bar by Bar. Wiley, 2009.
Documented observation: structure levels are frequently breached and recovered within single candles during high-impact news releases (NFP, central bank decisions). This is a known failure mode and is included in the framework limitations. Position management around news events requires separate handling.
Kemiworld Markets internal documentation, 2024–2025
Research Notes
Theoretical foundation and practitioner references.
The concept of trend as defined by a sequence of swing highs and swing lows originates in Charles Dow's market theory (1900s), later formalised in Robert Rhea's The Dow Theory (1932). The core principle — that a trend persists until it gives a definitive signal of reversal — remains foundational in technical analysis.
Key references:
- Dow, C. (1900-1902). Editorials in The Wall Street Journal. Original articulation of trend structure as successive peaks and troughs.
- Rhea, R. (1932). The Dow Theory. Barron's. Formalised the swing-based trend definition.
- Murphy, J. (1999). Technical Analysis of the Financial Markets. NYIF. Modern textbook treatment of trend identification via swing analysis.
- Brooks, A. (2012). Trading Price Action Trends. Wiley. Practitioner-level application of swing structure to intraday and swing trading.
- Wyckoff, R. (1931). The Richard D. Wyckoff Method of Trading and Investing in Stocks. Institutional accumulation/distribution phases explained through structural analysis.
Important context:
These references describe the logic and mechanics of structural analysis. They do not guarantee that identifying a trend via HH/HL or LH/LL produces a statistical edge in isolation. The framework's value is as a context filter — it improves the probability of other entry models by ensuring you trade in the direction of the prevailing structure.
Validation approach:
Apply the structural read to 50 charts across multiple pairs. Score how often the structural state persisted for the next 5-10 candles after identification. Track how often trades taken in the direction of the structural state outperform trades taken against it. Your own data is the only valid evidence.
Learn the Full Framework
The concepts behind this strategy are covered in the Foundations course.
Start the Course →Full Documentation
Annotated examples, failure breakdowns, and complete evidence.
View VIP Access →