
Overview
A foundational framework for taking structure-based entries across forex pairs and XAUUSD. Built on top-down directional bias, key level interaction, and defined risk parameters. This is an educational framework — not a signal, not a guarantee of profitability.
Before using this strategy:
When to Use This Strategy
- ✓You are learning structural analysis and want a simple entry model
- ✓The Daily chart shows a clear directional trend
- ✓You have identified a key level with at least two confluences
- ✓You can define your stop and target before entering
When NOT to Use It
- ✗The market is ranging or choppy on the Daily
- ✗You cannot identify at least two confluence factors at the entry zone
- ✗You are unsure which structural state the market is in
- ✗You have not completed the Foundations course yet
Framework Overview
This framework documents the minimum conditions required to take a trade within a structure-based approach. It is not a pattern to hunt — it is a process to follow. The goal is to ensure every trade has a documented reason to exist and a clearly defined point where the idea is wrong.
How the Framework Works
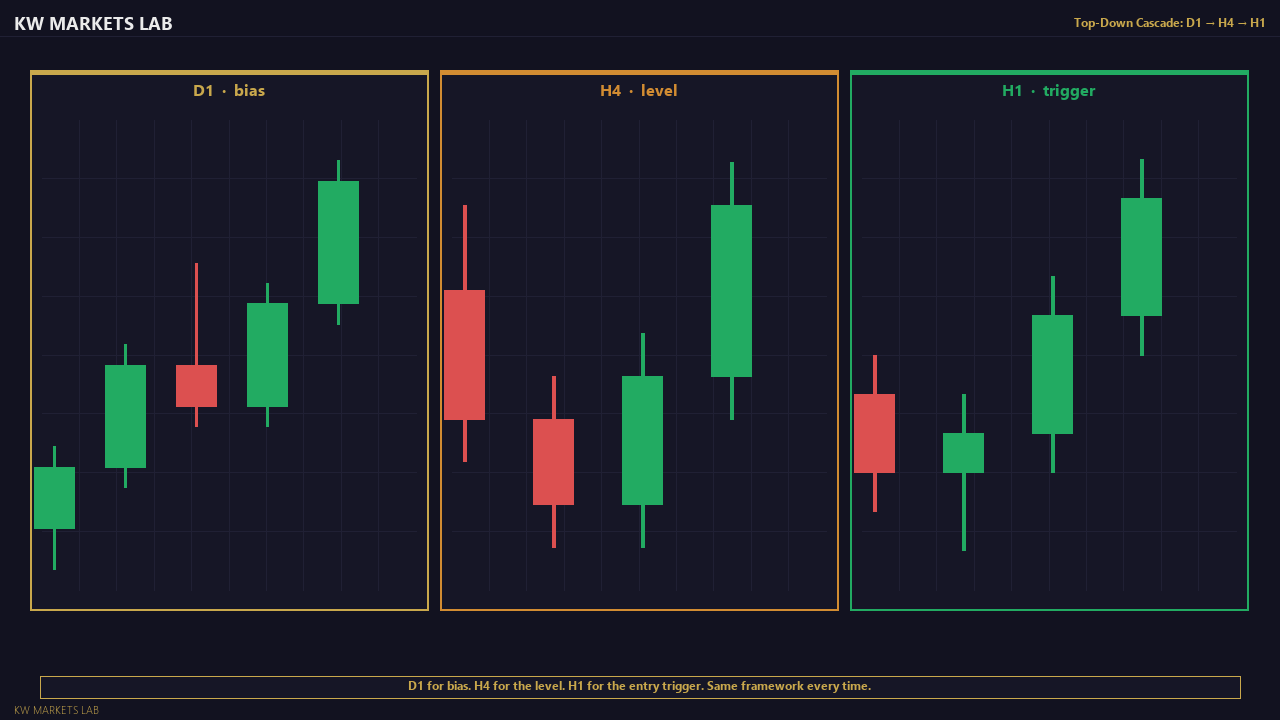
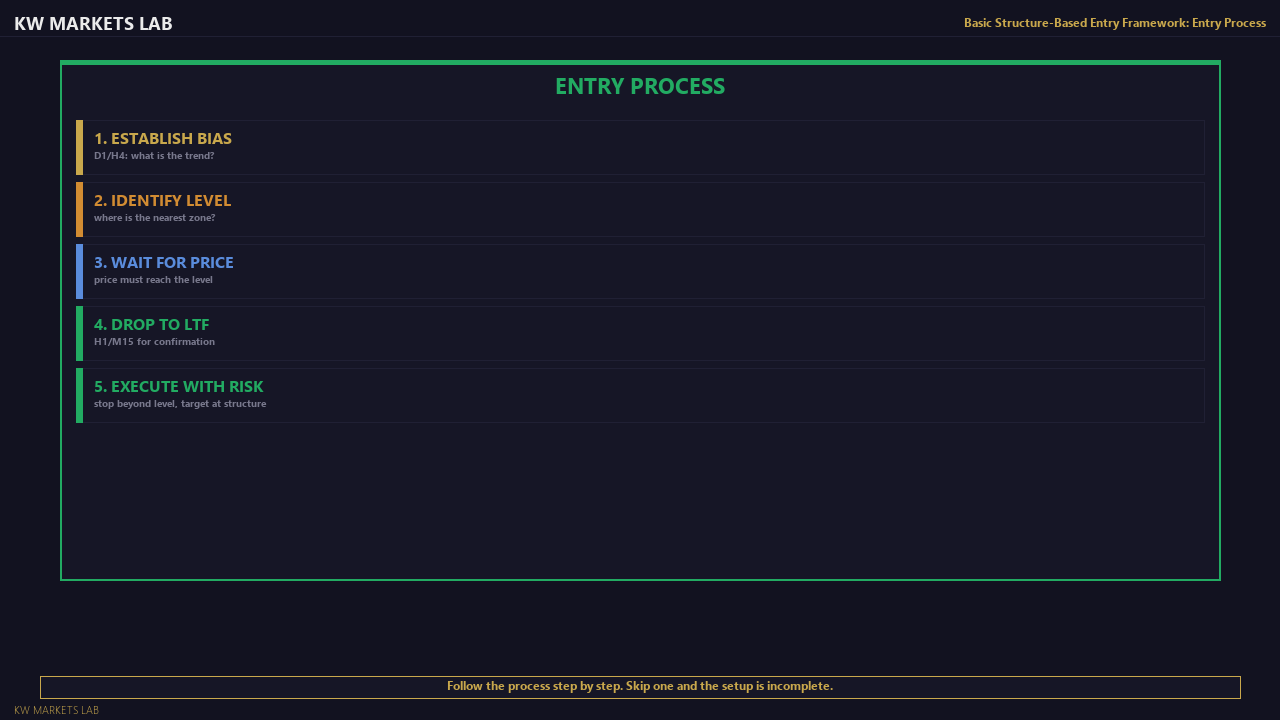
The logic runs top-down. You begin on the higher timeframe (Daily or H4) to establish directional bias, then drop to a lower timeframe (H1 or M15) to find a confirmation trigger at a defined level.
Three things must be present simultaneously:
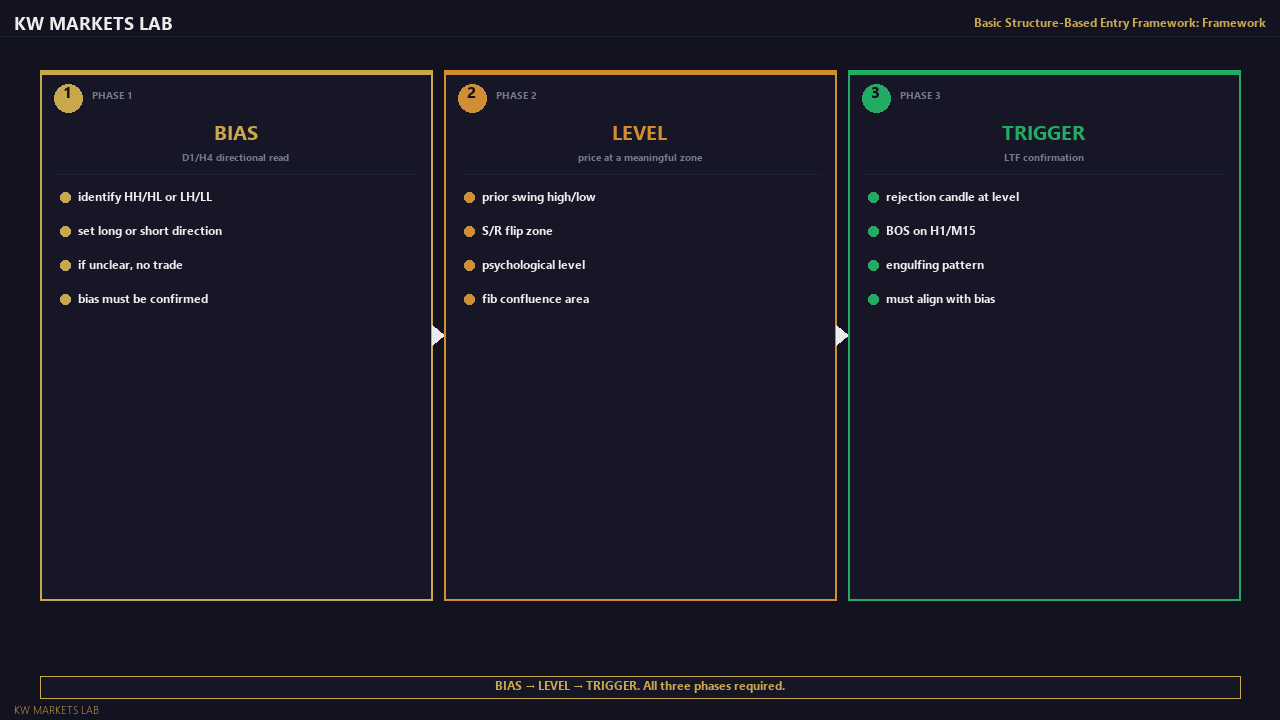
1. A clear structural direction on the higher timeframe.
Higher highs and higher lows = bullish bias. Lower highs and lower lows = bearish bias. If neither sequence is clear, there is no directional bias and therefore no trade.
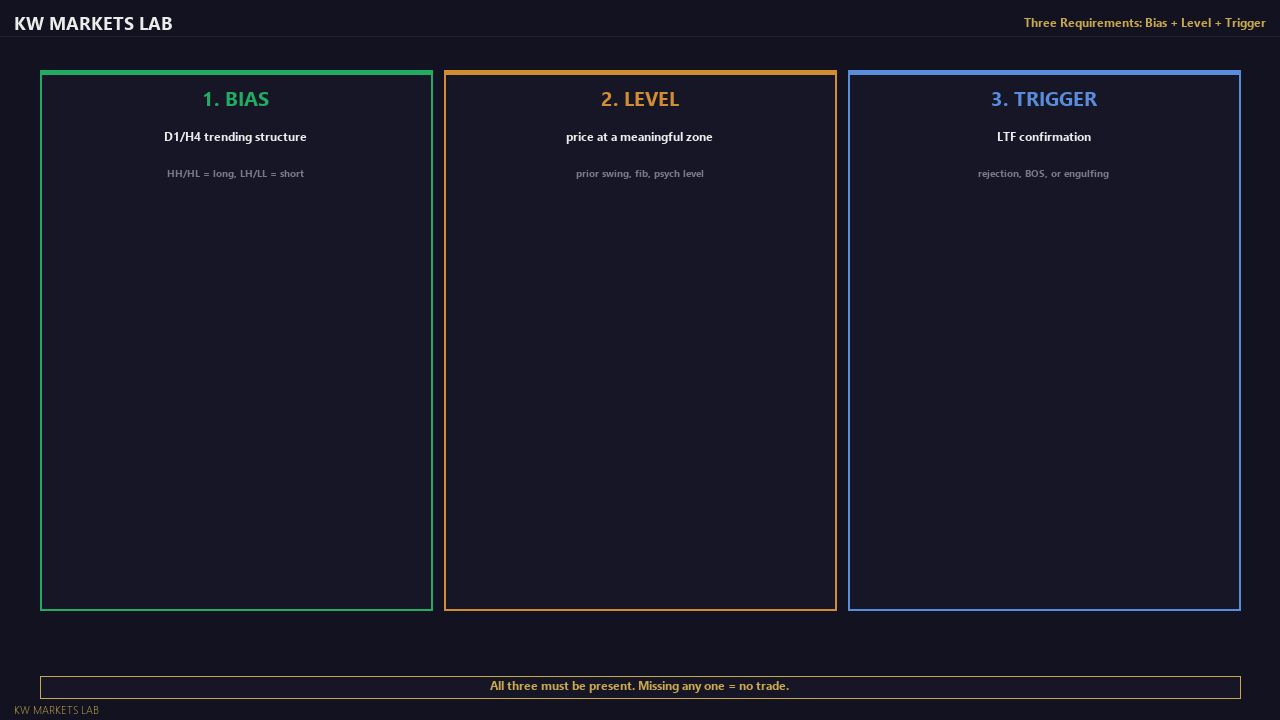
2. Price at or approaching a meaningful level.
Not anywhere on the chart — at a documented zone where price has previously reacted. A zone tested twice is more reliable than one tested once. A zone tested and then broken, now acting as role reversal, is particularly significant.
3. A lower-timeframe entry trigger.
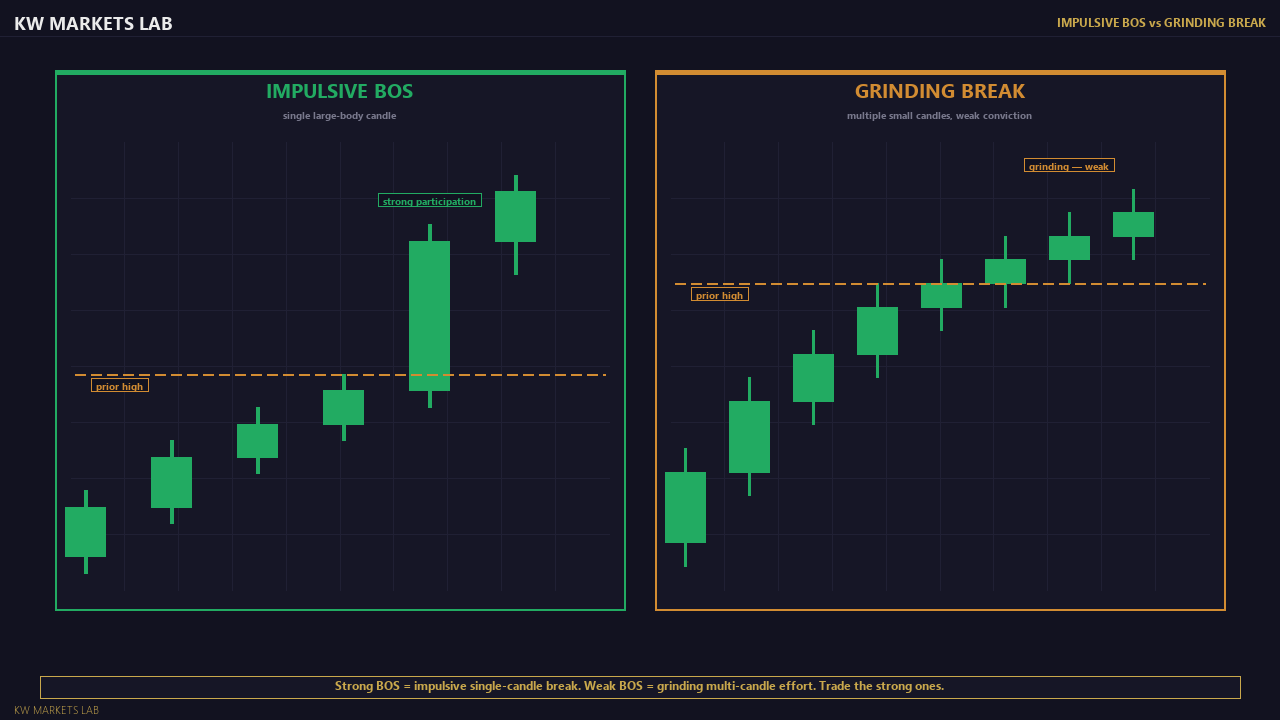
Not just "price is near the zone." A structural event: a small BOS on H1, a rejection candle on M15, a consolidation that breaks in the direction of the bias. The zone is context. The trigger is the event that confirms commitment at that level.
What to notice: Does the confluence of all three elements exist, or are you trading on one or two? Partial alignment is the most common source of entries that fail for no apparent reason.
A diagram visual here would show the three-layer top-down structure: Daily trend → H4 approach to the zone → H1 trigger event, with each layer annotated.
Example Walkthrough
Setup: EURUSD Daily chart in a clear uptrend — three consecutive higher highs and higher lows over the past two weeks.
Step 1 — Establish bias.
Daily shows bullish structure. The last higher low held cleanly. You are looking for long opportunities only. Bearish setups are off the table while this structure holds.
Step 2 — Identify the level.
Price pulls back toward the previous Daily swing high that was broken last week. That level is now acting as support via role reversal. You mark the zone before price arrives at it.
Step 3 — Drop to H4.
Price approaches the zone on H4. You observe price beginning to compress — candles become smaller, range tightens. The zone is holding so far. No entry yet.
Step 4 — Drop to H1 for the trigger.
H1 has been making lower highs during the pullback. Then it flips: a higher high forms on H1 within the support zone. This is a Break of Structure in the direction of the Daily bias. This is the trigger.
What to notice: The entry is not taken because price touched the zone. It is taken because price touched the zone, held, and then showed a structural reason to move higher on the lower timeframe. That combination is the setup. One element alone is not.
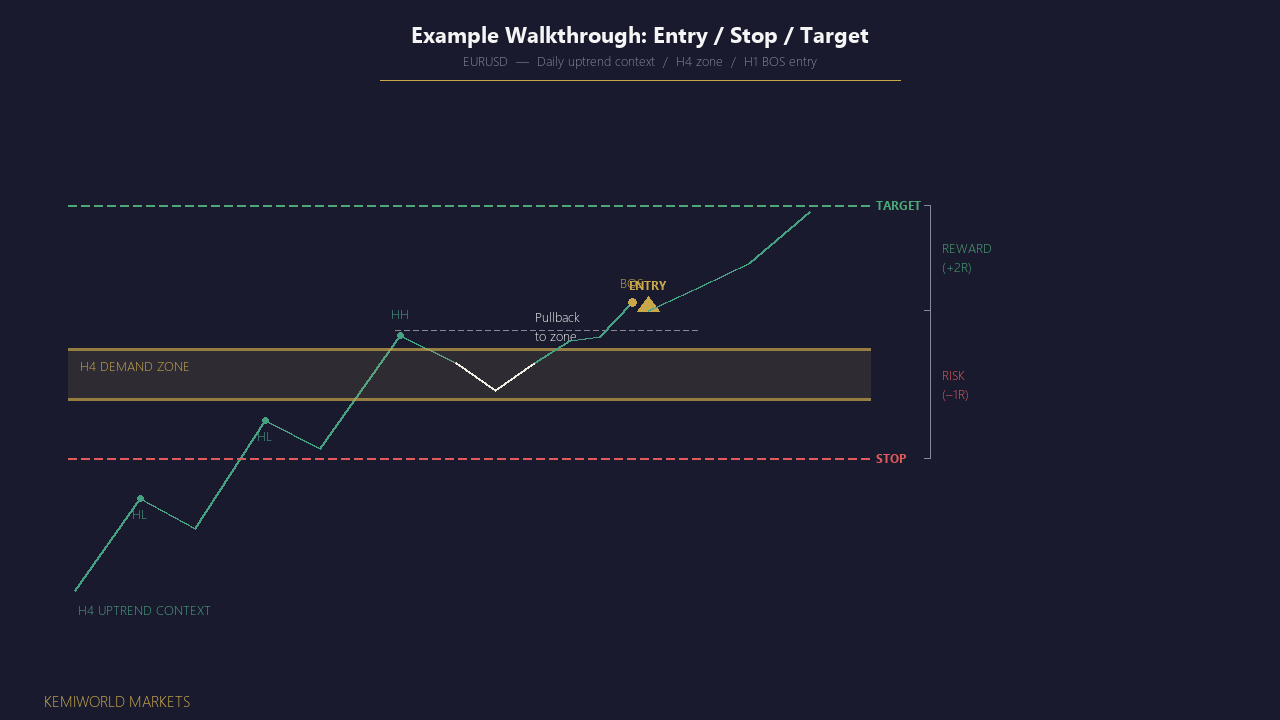
Step 5 — Execute with defined risk.
Entry at or just above the H1 BOS level. Stop placed below the lowest wick that has respected the zone, plus a small buffer. Risk = 1% of account. Position size calculated from that dollar amount and the pip distance to the stop — not from conviction or setup quality.
Step 6 — Set the target.
Previous H4 swing high, approximately 2.2× the risk amount. Do not move the target higher mid-trade unless a clear structural reason exists.
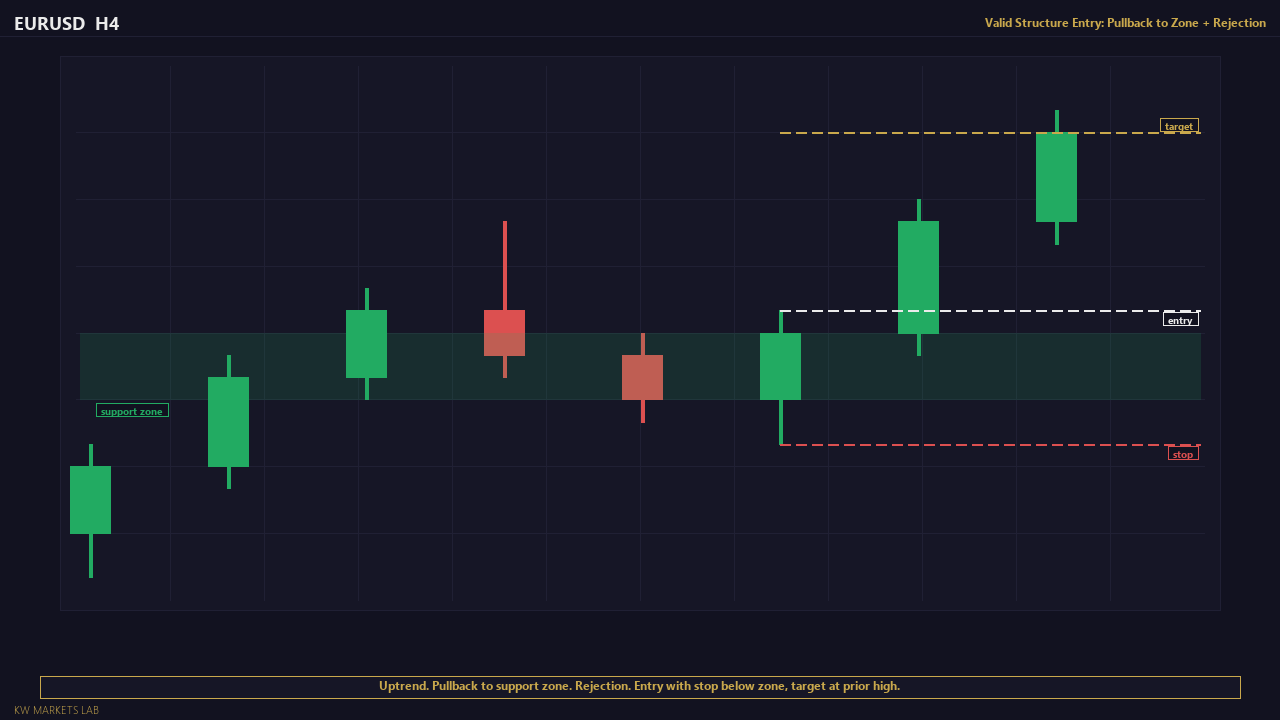
A chart_example visual here would show: the Daily uptrend with the pullback zone marked, H4 compression at the zone, and the H1 BOS trigger annotated with entry, stop, and target levels.
Market Conditions Required
This framework is designed as a learning tool for traders building their first structured process. It requires:
- A clear Daily trend (identifiable HH/HL or LH/LL) — if you cannot identify the trend, practice structural reading before attempting entries.
- A key level with at least 2 confluence factors (prior swing + round number, or prior swing + Fibonacci level, etc.). A single-factor level is not sufficient.
- Normal market conditions — not during high-impact news, not during extreme volatility, not during holiday-thin markets.
What Makes This Setup Weak
- Only one confluence factor at the key level. This framework explicitly requires 2+ confluences. A level with only one supporting factor is a B-grade setup at best — reduce size or skip.
- The structural read is unclear. If you spent more than 30 seconds deciding whether the structure is bullish or bearish, it is ambiguous. Ambiguous structure = no trade.
- The entry level has a structural obstacle between it and the target. If resistance sits 20 pips above your long entry, the target cannot be reached. Check for obstacles before entering.
- You cannot clearly define your stop before entry. If the stop placement is not obvious from the structure, the setup is not clean enough.
Common Beginner Mistake
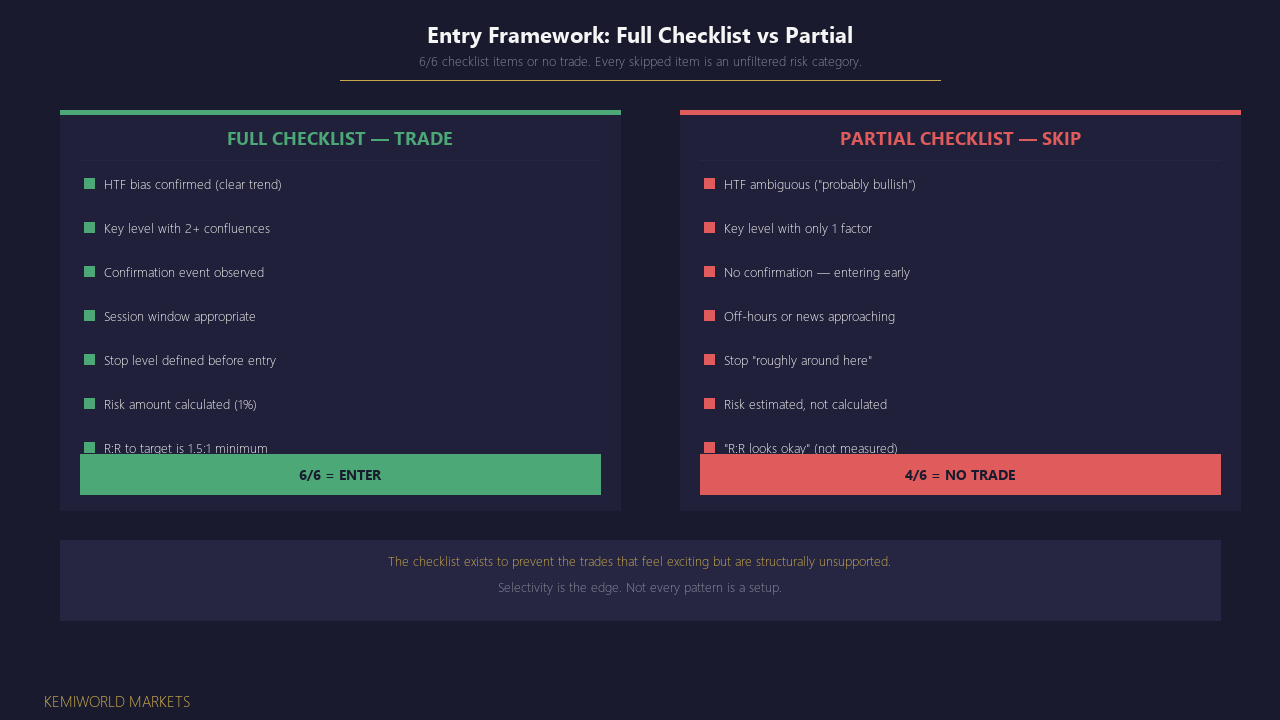
Skipping the pre-entry checklist. This framework is built around a checklist: HTF bias confirmed, key level identified, confluence present, confirmation event occurred, stop defined, risk calculated. Beginners skip items 3-6 because they are excited about item 1. The checklist exists because each item filters out a category of bad trades.
The second mistake: not logging trades. This framework is explicitly a learning tool. Every trade taken with this framework should be logged with the full breakdown: context, setup, execution, management, outcome, process audit. If you are not logging, you cannot evaluate whether the framework works for your execution.
What Experienced Traders Notice
- This framework is intentionally conservative. It is not designed to capture every move — it is designed to teach the process of structured decision-making. Experienced traders who use this framework will naturally evolve it into more specialised setups (BOS continuation, kill zone reversal, etc.) as their structural reading improves.
- The confluence requirement is the strongest filter. Most beginners cannot identify 2 confluence factors consistently. This is the skill that separates random entries from structured entries.
- The framework teaches when NOT to trade as much as when to trade. If any checklist item fails, the trade is invalid. Learning to sit out is the hardest and most valuable skill this framework develops.
When to Skip This Trade
- You cannot identify 2 or more confluence factors at the key level
- The structural read took more than 30 seconds to determine (ambiguous)
- You cannot clearly define where your stop goes before entry
- A high-impact news event is due within 30 minutes
- You have not completed the pre-entry checklist in full
- You are entering "because the chart looks good" rather than because specific conditions are met
Entry Conditions
No trade is taken unless all of the following align. Partial alignment — two out of four, or three out of four — is still a no-entry.
1. Directional bias confirmed on Daily or H4
Daily or H4 shows a clear structural sequence: HH/HL (bullish) or LH/LL (bearish). If the higher timeframe is consolidating, ranging, or the last major structure event was a CHOCH without follow-through, no directional trade is taken.
What to notice: bias is read from structure, not from recent candle direction. A bearish candle in a clear uptrend does not change the bias. A confirmed CHOCH on H4 does. Know the difference.
2. Price at a pre-identified key level
Price is testing a zone that was marked before price arrived — a structural support/resistance area, a broken structure level now acting as role reversal, or a prior session high or low. The zone must have at least one prior test to be considered established.
What to notice: if you drew the zone after price arrived at it, it is hindsight — not analysis. Levels drawn after the fact produce the illusion of a setup. Levels identified in advance and then tested are valid context.
3. Lower-timeframe structural confirmation
H1 or M15 shows a reaction at the zone: a BOS in the direction of the bias, a clear rejection pattern, or a consolidation that resolves in the trade direction. Price sitting at a zone is context. A structural event at the zone is the trigger.
What to notice: confirmation is not "price bounced a little." It is a structural event — a clear break of a recent swing high or low on H1 or M15, showing that buyers (or sellers) have committed at this specific level. Without this, the zone has not yet been defended.
4. No entry mid-structure or between levels
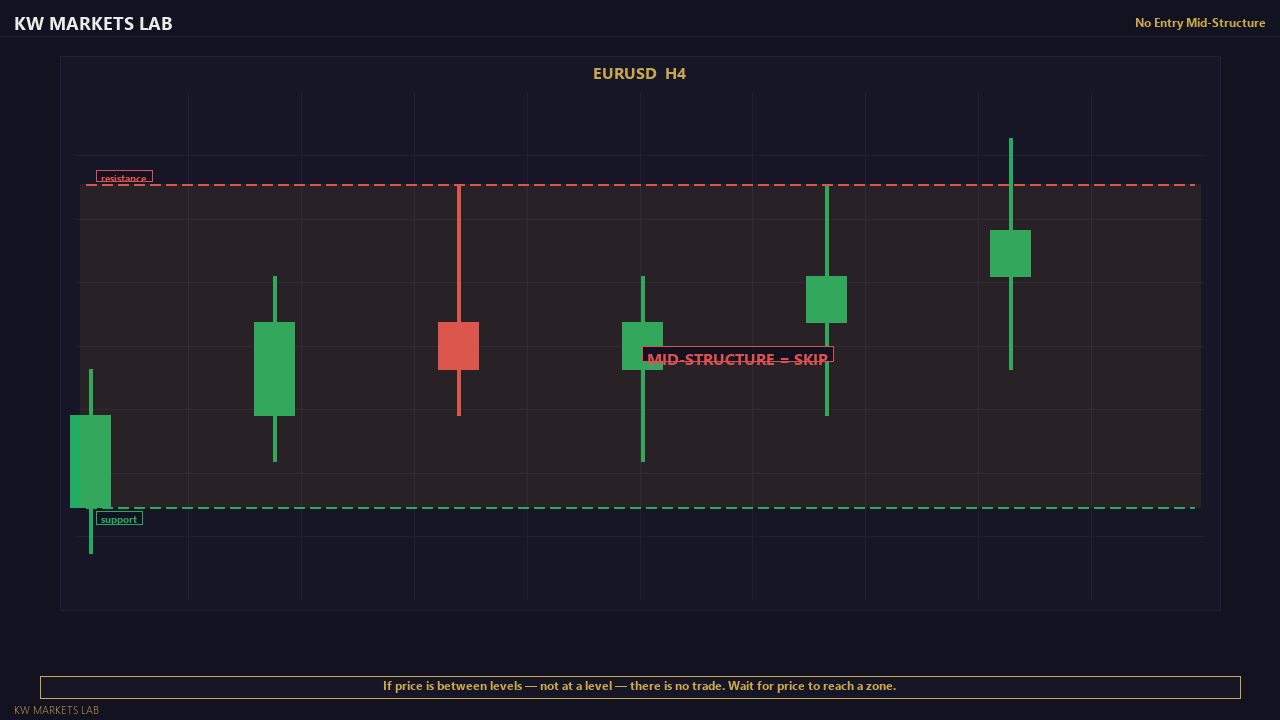
If price is between two defined levels with no clear bias or trigger, there is no setup. Entries mid-move, mid-range, or away from a defined level are not valid within this framework regardless of how strong the candle pattern looks in isolation.
What to notice in a setup_visual: the image would show the top-down alignment — Daily trend direction, H4 approach to the zone, H1 BOS trigger — with the entry level marked and the stop level annotated clearly below the zone.
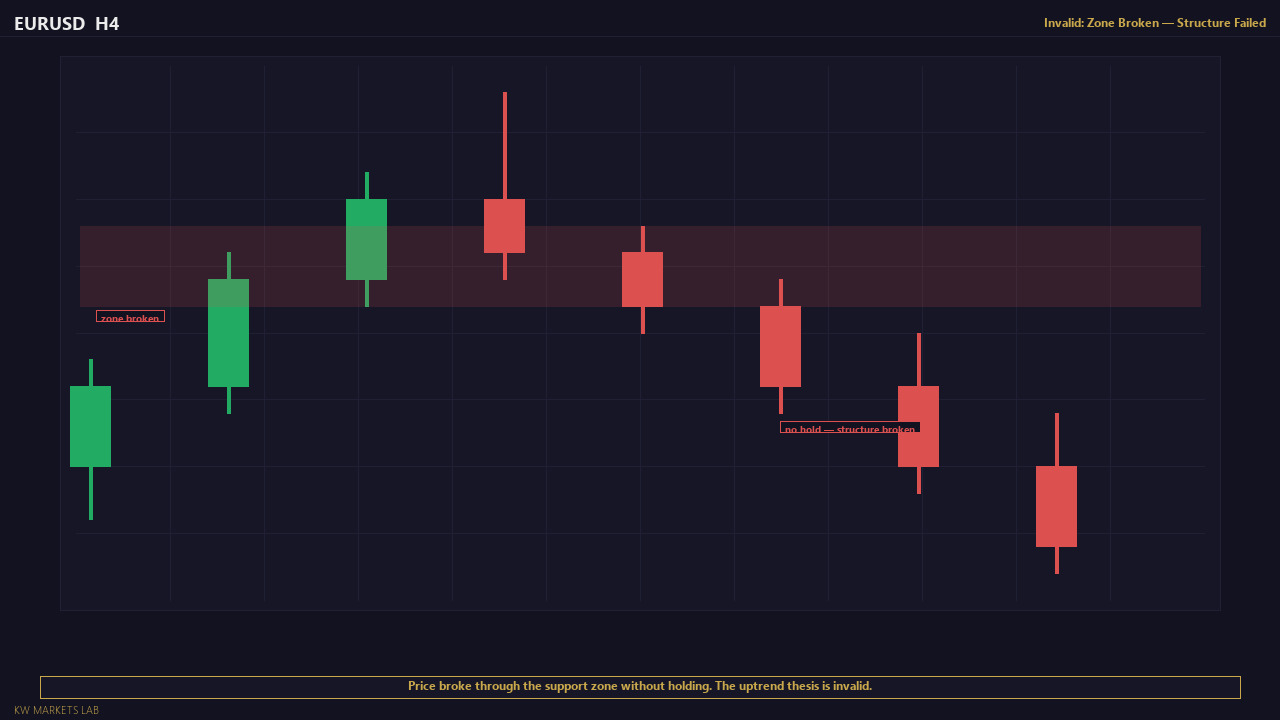
Failed Setup Example
EURUSD Daily is bullish. You identify a key level at 1.0820 based on a prior swing low. No other confluence factor exists — no Fibonacci alignment, no round number, no demand zone. You enter long at 1.0825 because "the level looks interesting."
Why this fails: only one confluence factor (prior swing). The framework requires 2+. Without additional confluence, the level is weak — it may hold or it may not. Price drops through 1.0820 to 1.0790 before bouncing. With proper confluence (e.g., the 61.8% Fibonacci retracement also sitting at 1.0818), the entry would have been an A-grade setup. Without it, it was a guess.
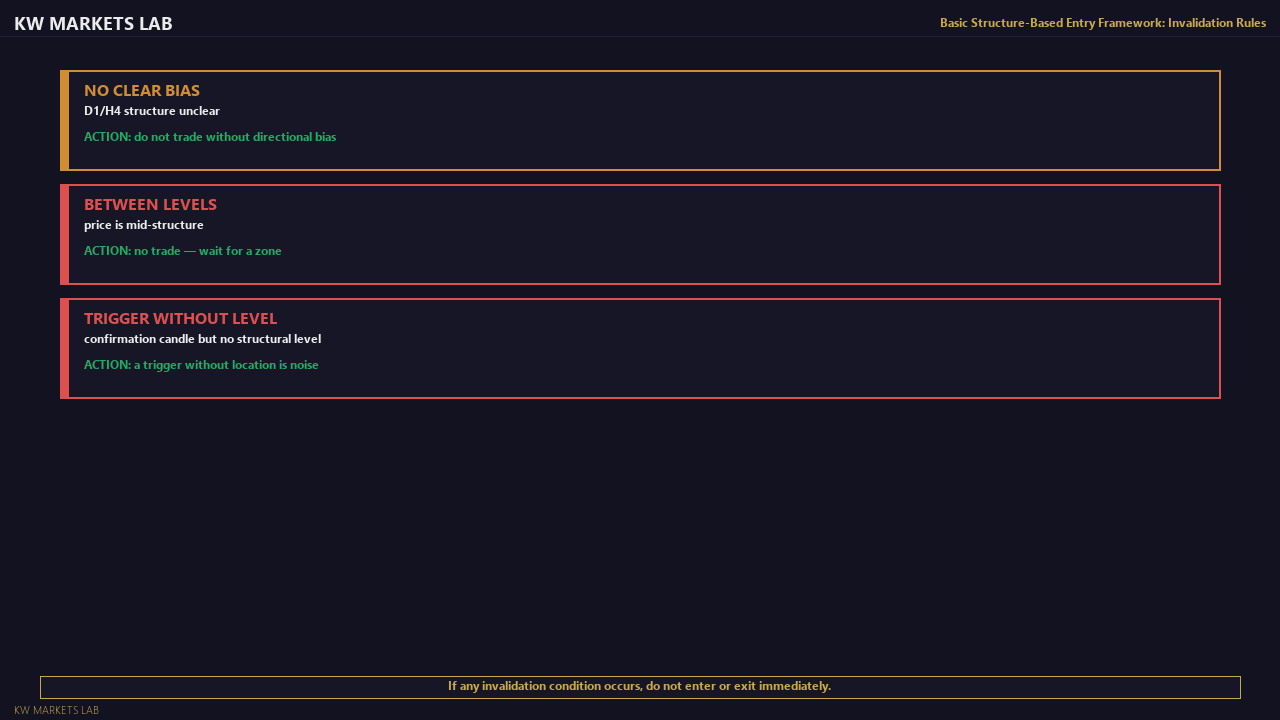
Invalidation & Risk Rules
The trade idea is structurally wrong when any of the following occur:
- Price closes beyond the structural stop level — not just touches it. A brief wick through is not invalidation. A candle body closing beyond the swing point that anchors the setup is.
- The higher-timeframe bias reverses before entry forms. If a CHOCH appears on H4 while waiting for H1 confirmation, the directional thesis is gone. Do not take the entry.
- The key level is traded straight through with no reaction. If price does not pause or respond at all, the zone has failed to hold. There is no setup.
What to notice: the most common mistake is treating a wick breach as invalidation and exiting early — then watching price return into the zone and continue. Structural invalidation is about candle closes, not intrabar spikes.
A failure_case visual here would show two scenarios side-by-side: (1) a valid wick through a zone that did not close beyond — no invalidation, setup still active; (2) a candle close beyond the stop level — setup cancelled, no waiting for recovery.
Stop Loss Placement
The stop goes behind the structural point that defines the trade — not at an arbitrary distance.
For a long setup: below the lowest wick that has respected the support zone, plus a small buffer (3–7 pips depending on instrument and timeframe). The buffer accounts for spread and minor wick extensions without sitting inside the zone itself.
For a short setup: above the highest wick that rejected the resistance zone.
What to avoid: fixed pip stops — e.g., always 25 pips — do not relate to where the trade idea is actually wrong. A 40-pip stop placed behind structural logic is sound. A 25-pip stop placed arbitrarily inside a 40-pip zone will be triggered by normal price movement within the zone, not by genuine invalidation.
The stop distance determines position size. It is not chosen based on how large a position you want — it is determined by where the trade is structurally wrong, and then the position size is calculated from that distance against your account risk percentage.
The "Good Enough" Trap
The most common framework violation: entering when only 4 out of 6 checklist items are met and telling yourself the other 2 "probably don't matter this time." They matter every time. The checklist is designed so that every skipped item represents a category of risk you are not filtering. If you consistently skip item 4 (confirmation event), you are entering before the market confirms your idea — and your win rate will reflect that.
Rule: 6/6 or no trade. If the checklist feels too restrictive, that is the framework working correctly — it is preventing the trades that feel exciting but are structurally unsupported.
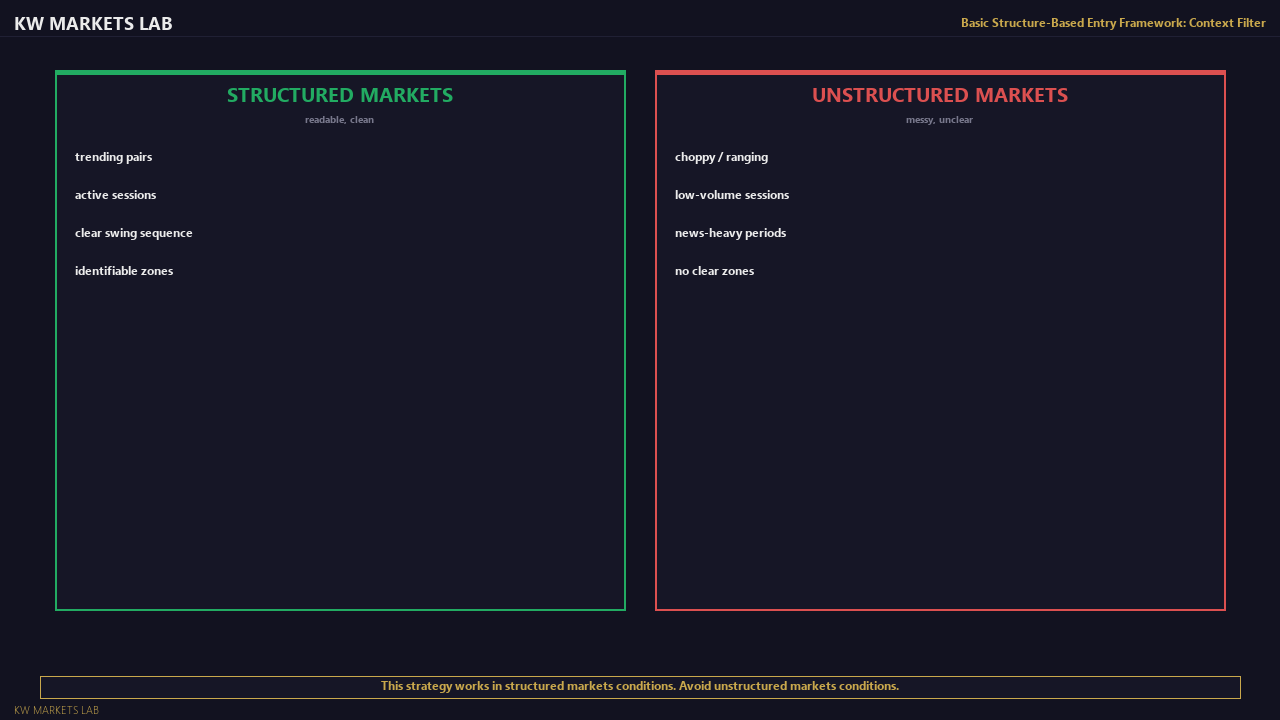
Where It Works
- Trending sessions with clear directional structure — London open, New York open
- Instruments with defined session behaviour: XAUUSD during London/NY overlap, major forex pairs during session hours
- Higher timeframe levels with multiple prior tests (better established, more likely to be defended)
- When the higher timeframe trend has been running for multiple days without a CHOCH
Where It Fails
- Low-liquidity periods (Asian session on most pairs except JPY pairs and gold with caveats)
- Inside days and tight Daily consolidation — no structural bias means no valid directional trade
- Immediately before or during high-impact scheduled news unless the trade was pre-planned with deliberate wider parameters
- When price has been ranging for multiple sessions and levels overlap without clear sequence
Known Limitations
- Requires a clear trending environment on the higher timeframe. Performs poorly in low-volatility ranging markets — if there is no structural bias, there is no bias-dependent trade.
- Zone identification involves judgement. Two traders drawing the same chart may mark slightly different zones. Consistency within your own framework matters more than external agreement.
- Lower-timeframe confirmation adds a small entry delay. In fast-moving markets, the trade may move before confirmation forms — accept the miss rather than chasing.
- Does not account for major news events. High-impact releases (NFP, CPI, FOMC) can invalidate structural setups instantly.
Visual Examples
Research Notes
Framework derived from classical technical analysis literature (Dow Theory, Wyckoff method, Edwards & Magee) and documented across the Foundations of Trading course: M2 (market structure), M3 (key levels), M4 (top-down analysis), M6 (risk management). This is an educational framework — not a signal system, not a managed account offering, and not a guarantee of profitability. See /proof for how we document evidence and methodology.
Learn the Full Framework
The concepts behind this strategy are covered in the Foundations course.
Start the Course →Full Documentation
Annotated examples, failure breakdowns, and complete evidence.
View VIP Access →